

 Klaviyo Integration
Klaviyo powers your retention marketing. KPI Tree proves which flows actually retain customers.
Klaviyo gives you per-flow and per-campaign metrics - open rates, click rates, revenue attributed, placed order rates.Klaviyo gives you per-flow and per-campaign metrics - open rates, click rates, revenue attributed, placed order rates. But those metrics live inside Klaviyo, disconnected from your broader e-commerce performance. KPI Tree takes your Klaviyo data and maps it into causal metric trees: welcome flows feed into first-purchase conversion, post-purchase flows feed into repeat purchase rate, winback flows feed into reactivation and LTV. Each metric has an owner. Statistical correlations replace guesswork. You stop wondering which flow matters and start proving it. Connect via MCP to pull Klaviyo data directly, point KPI Tree at your existing data warehouse where Klaviyo data already lands, or let our Professional Services team build the AI foundations for you.
From connection to retention marketing accountability in under an hour
Connect your Klaviyo data
Three ways to get started, depending on your stack.

Pull metrics from Klaviyo directly through the Model Context Protocol.



Connect your existing warehouse where Klaviyo data already lands.


Our professional services team can build you turn-key AI foundations in a matter of weeks. Data warehouse on Snowflake/BigQuery, ELT with Fivetran, all modelled in dbt with a semantic layer.
Map metrics from your Klaviyo data
Define metrics from your Klaviyo tables - email open rates, click-through rates, placed order rates, revenue per recipient, list growth rate, unsubscribe rate, SMS delivery rate, flow completion rate, and attributed revenue by flow and campaign. Use SQL, your dbt semantic layer, or natural language with Cortex Analyst.
Build metric trees and assign ownership
Arrange retention marketing metrics into causal trees. Link welcome flow performance to first-purchase conversion. Connect post-purchase email engagement to repeat purchase rate. Map winback flow metrics to reactivation and customer lifetime value. Assign RACI owners - your email marketing manager owns flow performance, your e-commerce lead owns attributed revenue, your CRO specialist owns conversion metrics.
Retention marketing metrics that connect to customer lifetime value
Causal trees from flow engagement to lifetime value
Statistical proof of which flows drive retention
Alerts when retention metrics move, not just campaign reports
See how email and SMS flows actually drive repeat purchases and LTV.
- Causal trees linking flow engagement to first purchase, repeat purchase, and LTV
- Combine Klaviyo data with Shopify/Stripe revenue in a unified tree
- Trace retention metric changes to the specific flow or segment causing them
- Period-over-period comparisons across your full retention funnel
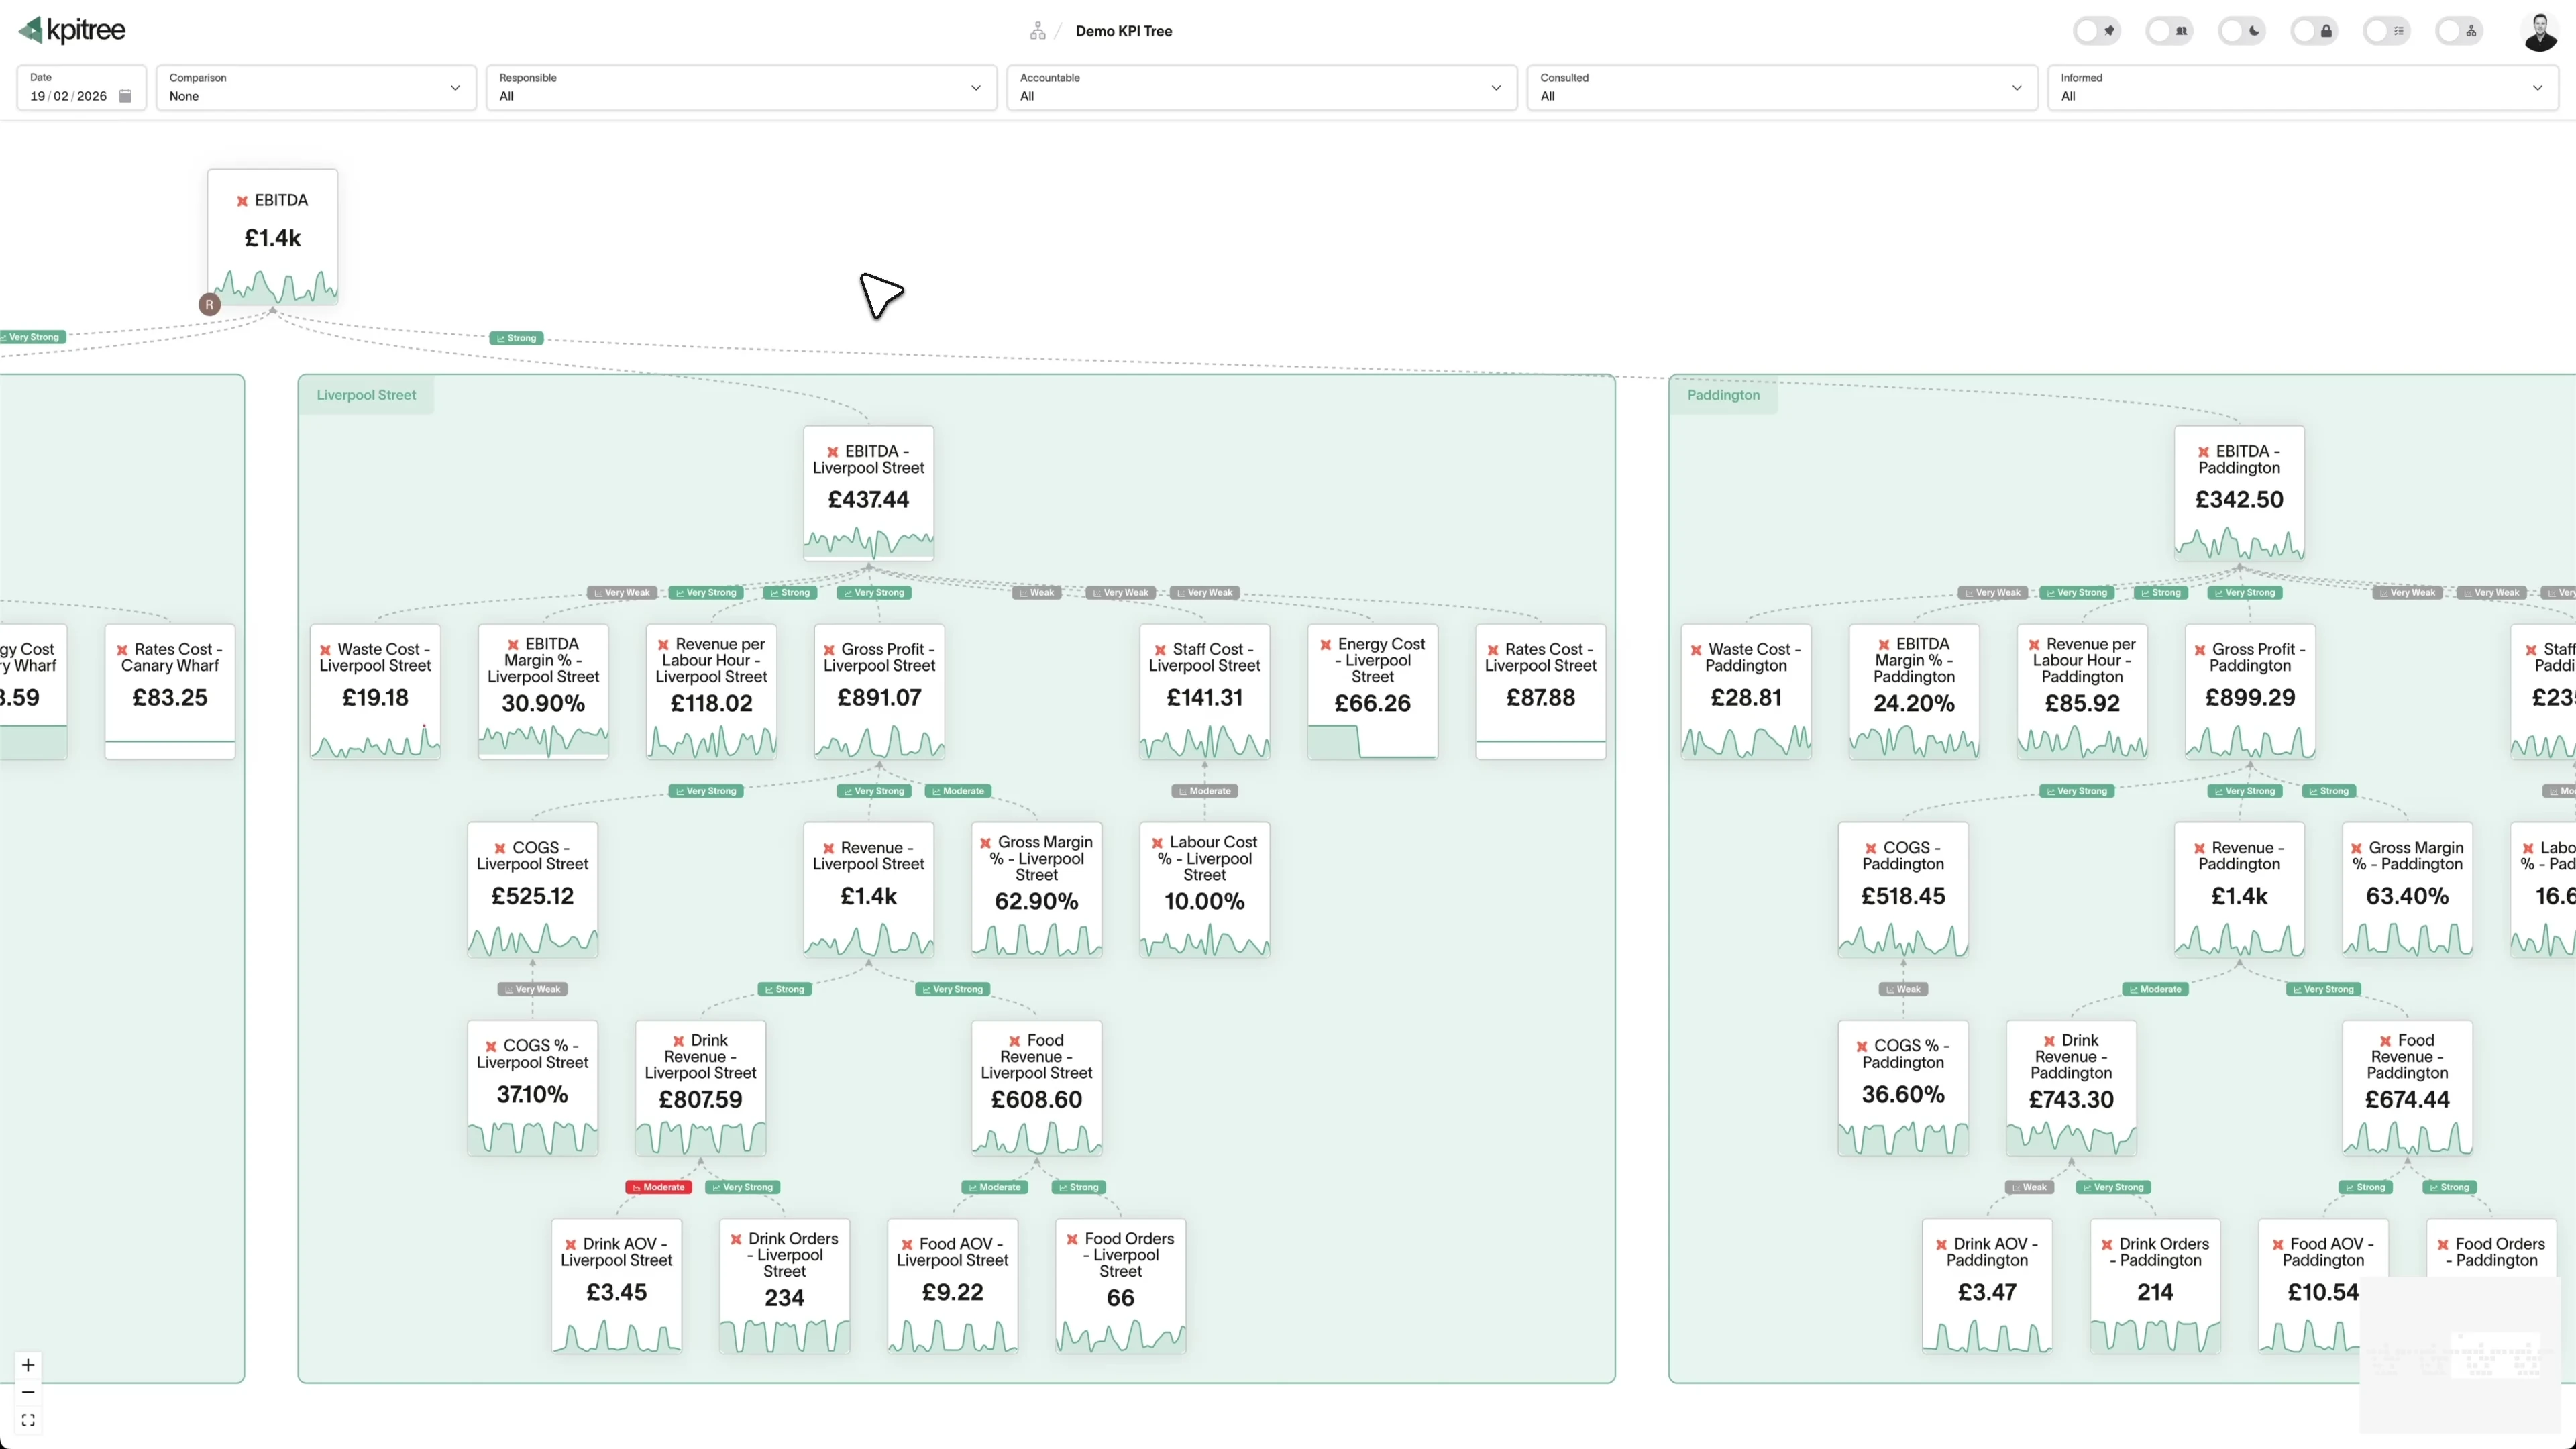
Every flow metric has an owner. Every decline gets investigated.
- RACI ownership per metric - not per flow or per campaign
- Push notifications via Slack or email with context
- Action tracking tied to specific retention metric movements
- Impact verification after changes to flows, segments, or content
Correlations that tell you where to invest your email programme.
- Statistical correlation between flow engagement and customer LTV
- Causality testing to identify leading retention indicators
- Partial correlations controlling for purchase frequency and average order value
- Statistical significance thresholds so you act on signal, not noise
Klaviyo data analysed off-warehouse, accessible to your whole team.
- One scheduled query per metric, regardless of team size
- All analytics computation runs off-warehouse
- Supports Snowflake, BigQuery, and other major warehouses
- Works alongside your existing dbt semantic layer if you have one
How KPI Tree uses Klaviyo data differently
Klaviyo has excellent built-in reporting for flow and campaign performance. BI tools put that data in dashboards. KPI Tree connects retention marketing metrics to customer lifetime value with causation, ownership, and accountability.
Data warehouses
The numbers





Semantic layers
The definitions


Business apps
Launches, decisions, blockers




Org structure
Directory-synced




For humans
Answers, briefings and pushes
 @
@Read and write over MCP
Anthropic: 21% → ~95% with curated context



Canopy Agentic Workflows the metrics start them, humans gate them
Canopy Agents four out of the box, any model, your keys
Canopy
The business context layer
Structural context The causal tree, the org chart
Temporal context What was true when, plan against actual
Behavioural context What people did, what worked
Operational context RACI, workflows, approvals
Strategic context Objectives, key results, initiatives
Map & Measure
Metric Trees
Business Models
Prove & Act
Root Cause
Ownership
Verified Impact
Strategy
Grounded in proven causality
Verified proof
Meta spend → Revenue, +£32k vs forecast, q < 0.01
Personalised Action Plans 31 experiments running
hypothesis → a real person’s plan → measure the change
Causation the test cascade
ADF p 0.02 → Granger p 0.003 → q < 0.05, 87 of 1,204 survive
Correlation
22,791 pairs tested nightly, NPS – Churn r 0.71
Data warehouses
The numbers
Semantic layers
The definitions
Business apps
Launches, decisions, blockers
Org structure
Directory-synced
From flow reports to retention system understanding
Statistical analysis across your full e-commerce stack
Metric-level ownership for retention teams
Metrics you can track. Ready to add to your metric trees.
Abandoned Cart Recovery Rate
Email MarketingCart Recovery Rate = (Recovered Carts / Total Abandoned Carts) x 100
Abandoned cart recovery rate measures the percentage of shoppers who abandon their cart but subsequently complete a purchase after receiving a Klaviyo cart abandonment flow. It quantifies the direct revenue impact of your automated recovery messaging and the effectiveness of your abandonment strategy.
View metricCampaign Performance Comparison
Email MarketingCampaign performance comparison evaluates Klaviyo campaigns against each other on engagement, conversion, and revenue metrics. It identifies which campaign types, themes, and strategies consistently outperform others, providing evidence for editorial and promotional planning decisions.
View metricClick-Through Rate
Email MarketingClick-Through Rate = (Unique Clicks / Emails Delivered) x 100
Click-through rate measures the percentage of delivered Klaviyo emails where the recipient clicked at least one link. It indicates how effectively your email content and calls to action drive recipients to take the next step in their customer journey.
View metricCoupon Redemption Rate
Email MarketingCoupon Redemption Rate = (Coupons Redeemed / Coupons Distributed) x 100
Coupon redemption rate measures the percentage of Klaviyo email recipients who use a distributed coupon code to complete a purchase. It quantifies the effectiveness of promotional offers in driving conversions and provides insight into price sensitivity across different customer segments.
View metricCross-Sell Email Effectiveness
Email MarketingCross-sell email effectiveness measures how successfully Klaviyo cross-sell and product recommendation emails drive additional purchases. It evaluates whether personalised product suggestions in post-purchase flows and campaigns generate incremental revenue beyond what customers would have purchased organically.
View metricCustomer Journey Flow Analysis
Email MarketingCustomer journey flow analysis maps how Klaviyo subscribers progress through interconnected automated flows - from welcome series through post-purchase nurture to loyalty and winback sequences. It evaluates whether the overall flow architecture effectively guides customers through their lifecycle.
View metricCustomer Lifetime Value (Email)
Email MarketingEmail LTV = Average Email-Attributed Revenue per Customer x Average Customer Lifespan
Customer lifetime value from email measures the total revenue generated over the full customer relationship that is attributable to Klaviyo email and SMS engagement. It connects email programme investment to long-term customer value, providing the ultimate measure of retention marketing effectiveness.
View metricEmail Attribution Analysis
Email MarketingEmail attribution analysis evaluates how Klaviyo email and SMS touchpoints contribute to conversions across multi-touch customer journeys. It compares attribution windows, models how email interacts with other channels, and determines whether email initiates, assists, or closes conversions.
View metricEmail Deliverability Rate
Email MarketingDeliverability Rate = (Emails Delivered / Emails Sent) x 100
Email deliverability rate measures the percentage of Klaviyo emails that are successfully delivered to recipients' inboxes without bouncing. It encompasses hard bounces, soft bounces, and spam folder placement to assess the technical health of your email programme and sender reputation.
View metricEmail Engagement Cohort Analysis
Email MarketingEmail engagement cohort analysis groups Klaviyo subscribers by their signup date or acquisition source and tracks how their engagement evolves over time. It reveals whether newer cohorts engage as well as older ones and how quickly engagement decays after initial subscription.
View metricEmail Engagement Scoring
Email MarketingEmail engagement scoring assigns a composite score to each Klaviyo subscriber based on their open, click, purchase, and recency patterns. It provides a unified view of subscriber engagement that goes beyond any single metric to identify highly engaged, at-risk, and disengaged subscribers.
View metricEmail Frequency Optimisation
Email MarketingEmail frequency optimisation analyses the relationship between Klaviyo sending cadence and subscriber engagement, conversion, and unsubscribe outcomes. It identifies the optimal frequency for different segments that maximises revenue without accelerating list attrition.
View metricEmail List Health Score
Email MarketingEmail list health score is a composite metric combining Klaviyo list growth rate, engagement distribution, bounce rate, complaint rate, and unsubscribe rate to produce a single indicator of overall list quality. It assesses whether your subscriber base is growing, engaged, and deliverable.
View metricEmail Open Rate
Email MarketingOpen Rate = (Unique Opens / Emails Delivered) x 100
Email open rate measures the percentage of delivered Klaviyo emails that were opened by recipients. While affected by Apple Mail Privacy Protection and other privacy features, it remains a useful directional indicator of subject line effectiveness, sender reputation, and brand affinity when tracked consistently.
View metricEmail Revenue Attribution
Email MarketingEmail revenue attribution measures the total revenue attributed to Klaviyo email and SMS campaigns and flows within a defined attribution window. It quantifies the direct revenue contribution of your email programme and tracks how that contribution changes over time.
View metricEmail ROI
Email MarketingEmail ROI = ((Email-Attributed Revenue - Email Programme Cost) / Email Programme Cost) x 100
Email ROI measures the return on investment for your Klaviyo email programme by comparing attributed revenue against total email programme costs - including platform fees, design resources, copywriting, and operational overhead. It quantifies the financial efficiency of your entire email operation.
View metricEvent-Triggered Flow Performance
Email MarketingEvent-triggered flow performance measures the engagement, conversion, and revenue outcomes of Klaviyo flows triggered by customer behaviour events - such as browse abandonment, cart abandonment, post-purchase, and winback triggers. It evaluates how effectively your automated responses capitalise on behavioural signals.
View metricFlow Conversion Rate
Email MarketingFlow Conversion Rate = (Flow Conversions / Flow Recipients) x 100
Flow conversion rate measures the percentage of recipients who enter a Klaviyo automated flow and subsequently complete the desired conversion action - such as a purchase, signup, or re-engagement. It quantifies how effectively your automated sequences drive their intended outcomes.
View metricForm Conversion Rate
Email MarketingForm Conversion Rate = (Form Submissions / Form Views) x 100
Form conversion rate measures the percentage of visitors who view a Klaviyo signup form or popup and submit their information. It quantifies how effectively your email acquisition touchpoints convert anonymous visitors into identifiable, contactable subscribers.
View metricList Growth Rate
Email MarketingList Growth Rate = ((New Subscribers - Unsubscribes - Bounces) / Total Subscribers at Start) x 100
List growth rate measures the net rate at which your Klaviyo subscriber list expands over a given period, accounting for new subscriptions, unsubscribes, bounces, and manual removals. It indicates the trajectory of your addressable email audience and the sustainability of your acquisition efforts.
View metricProfile Enrichment Rate
Email MarketingProfile Enrichment Rate = (Profiles with Key Fields Populated / Total Profiles) x 100
Profile enrichment rate measures the percentage of Klaviyo subscriber profiles that have key data fields populated beyond the basic email address - such as name, preferences, purchase history, location, and behavioural attributes. It indicates how much personalisation data is available for targeting and content customisation.
View metricRepeat Purchase Rate (Email)
Email MarketingRepeat Purchase Rate = (Email-Engaged Customers with 2+ Purchases / Total Email-Engaged Customers) x 100
Repeat purchase rate from email measures the percentage of Klaviyo email-engaged customers who make a second or subsequent purchase within a defined period. It quantifies how effectively your email programme drives purchase frequency and customer retention beyond the initial transaction.
View metricSegment Performance Analysis
Email MarketingSegment performance analysis compares engagement, conversion, and revenue metrics across different Klaviyo audience segments. It evaluates whether your segmentation strategy effectively identifies distinct audiences with different needs and whether each segment receives appropriately targeted messaging.
View metricTemplate Performance Optimisation
Email MarketingTemplate performance optimisation evaluates how different Klaviyo email template designs, layouts, and structures affect engagement and conversion metrics. It identifies which design patterns - image-heavy versus text-based, single-column versus multi-column, short versus long - produce the best outcomes for different message types.
View metricUnsubscribe Rate
Email MarketingUnsubscribe Rate = (Unsubscribes / Emails Delivered) x 100
Unsubscribe rate measures the percentage of Klaviyo email recipients who opt out of future communications after receiving a message. It serves as a direct indicator of message relevance, frequency appropriateness, and the overall health of the relationship between your brand and its subscribers.
View metricRelated integrations. More sources that work with KPI Tree.


Common questions
Can I measure flow and campaign revenue attribution with Klaviyo?
Yes, and that is the most common reason ecommerce teams wire Klaviyo into KPI Tree. MCP is the fastest path: KPI Tree queries the Klaviyo Profile and Events APIs directly, reads flows, campaigns, segments, placed orders, and SMS sends, and produces attribution trees that link sends to opens to clicks to orders to revenue. High-volume Klaviyo accounts that have already built a warehouse replication via Fivetran, Hightouch, or the Klaviyo BigQuery Destination point KPI Tree at the warehouse instead and inherit the identity resolution they already invested in. Ecommerce teams that want Klaviyo attribution built for them engage our professional services team, which typically pairs the Klaviyo connector with Shopify or Stripe so the revenue numbers match the store of record.
What Klaviyo metrics can I track?
Any metric you can derive from your Klaviyo warehouse tables - email open rates, click-through rates, placed order rates, revenue per recipient, list growth rate, unsubscribe rate, bounce rate, SMS delivery rate, flow completion rate, and attributed revenue by flow, campaign, or segment. If it is in your warehouse, you can build a metric from it.
Can I combine Klaviyo metrics with Shopify or Stripe data?
Yes - this is the most common setup. Build a metric tree where Klaviyo flow engagement feeds into Shopify order data, Stripe revenue metrics, and Google Analytics traffic. KPI Tree runs correlations across all of them to show which email and SMS flows actually drive purchases and lifetime value.
Do I need a data warehouse to use KPI Tree with Klaviyo?
No. KPI Tree can pull Klaviyo data directly via MCP with no warehouse required. If you do have a warehouse, KPI Tree connects to it regardless of how the data got there. And if you need a warehouse but do not have one yet, our Professional Services team can build the full data foundation - Snowflake/BigQuery, Fivetran, and dbt - for you.
How long does setup take?
If you use MCP or already have Klaviyo data in a warehouse KPI Tree supports, setup takes under an hour. Connect via MCP or point KPI Tree at your warehouse, define metrics from your Klaviyo data, and start building trees. If you need a warehouse built from scratch, our Professional Services team handles that for you.
Does KPI Tree replace Klaviyo analytics?
No. Klaviyo's built-in analytics are excellent for flow-level and campaign-level optimisation - open rates, A/B test results, segment performance. KPI Tree adds the layer above: connecting those metrics to customer retention and lifetime value with causal trees, ownership, and cross-tool statistical analysis.
Can I track metrics at the segment level?
You define the SQL behind each metric, so you can track at whatever granularity your warehouse tables support - individual flow steps, full flows, campaigns, segments, or aggregate totals. Most e-commerce teams build a hierarchy: aggregate retention metrics at the top, with flow and segment breakdowns beneath.
What if I do not have a data warehouse?
You have two options. Use MCP to pull Klaviyo data directly into KPI Tree - no warehouse needed, ideal for getting started quickly. Or engage our Professional Services team, who will build a production-grade data foundation (Snowflake/BigQuery, Fivetran, and dbt) tailored to your stack, giving you richer historical data and the ability to join Klaviyo metrics with Shopify order data and Stripe revenue.
Related guides. Frameworks and metrics in depth.

How to build a metric tree
A step-by-step metric tree and KPI tree template from North Star to daily levers
Metric trees for e-commerce
Decompose revenue into the levers your teams actually control
Metric trees for marketing teams
Connect every campaign to revenue impact
Customer lifetime value: a metric tree decomposition
Decompose LTV into ARPU, gross margin, retention and expansion so you can see exactly which levers drive the value of every customer
Repeat customer rate: a metric tree decomposition
Understand what percentage of your customers come back for a second purchase and what drives that critical decision
Your Klaviyo flows drive retention. Make sure you can prove it.
Connect your warehouse to KPI Tree and turn Klaviyo email and SMS metrics into causal trees with ownership, statistical analysis, and accountability. See which flows drive lifetime value - and who is responsible for each one.










