
You close the month. Then the arguments start.
Finance teams spend the month assembling numbers and the meeting defending them. The work that actually matters, explaining what drove the miss and getting someone to act on it, happens afterwards, by email, if it happens at all.
Variance analysis that stops at the gap
Revenue missed by 8%. But was it volume, price, mix or churn? Your spreadsheet tells you the size of the gap. It does not tell you which operational metric three levels down actually moved. You present the shortfall, the board asks why, and you promise to follow up.
A plan and actuals that cannot agree on the maths
Your budget lives in a planning tool with its own aggregation logic. Your actuals live in the warehouse with another. When the two diverge, the first twenty minutes of every review are spent arguing about whose number is right, and the reforecast adds a third version. Nobody discusses why the number missed, because nobody trusts the number.
Every miss becomes finance's chase
The period closes. A target is missed. Nothing happens until someone in finance spots it, works out who to chase, and starts an email thread. By the time an owner is found and an action agreed, the next period is half gone, and there is no record of whether the last fix worked.
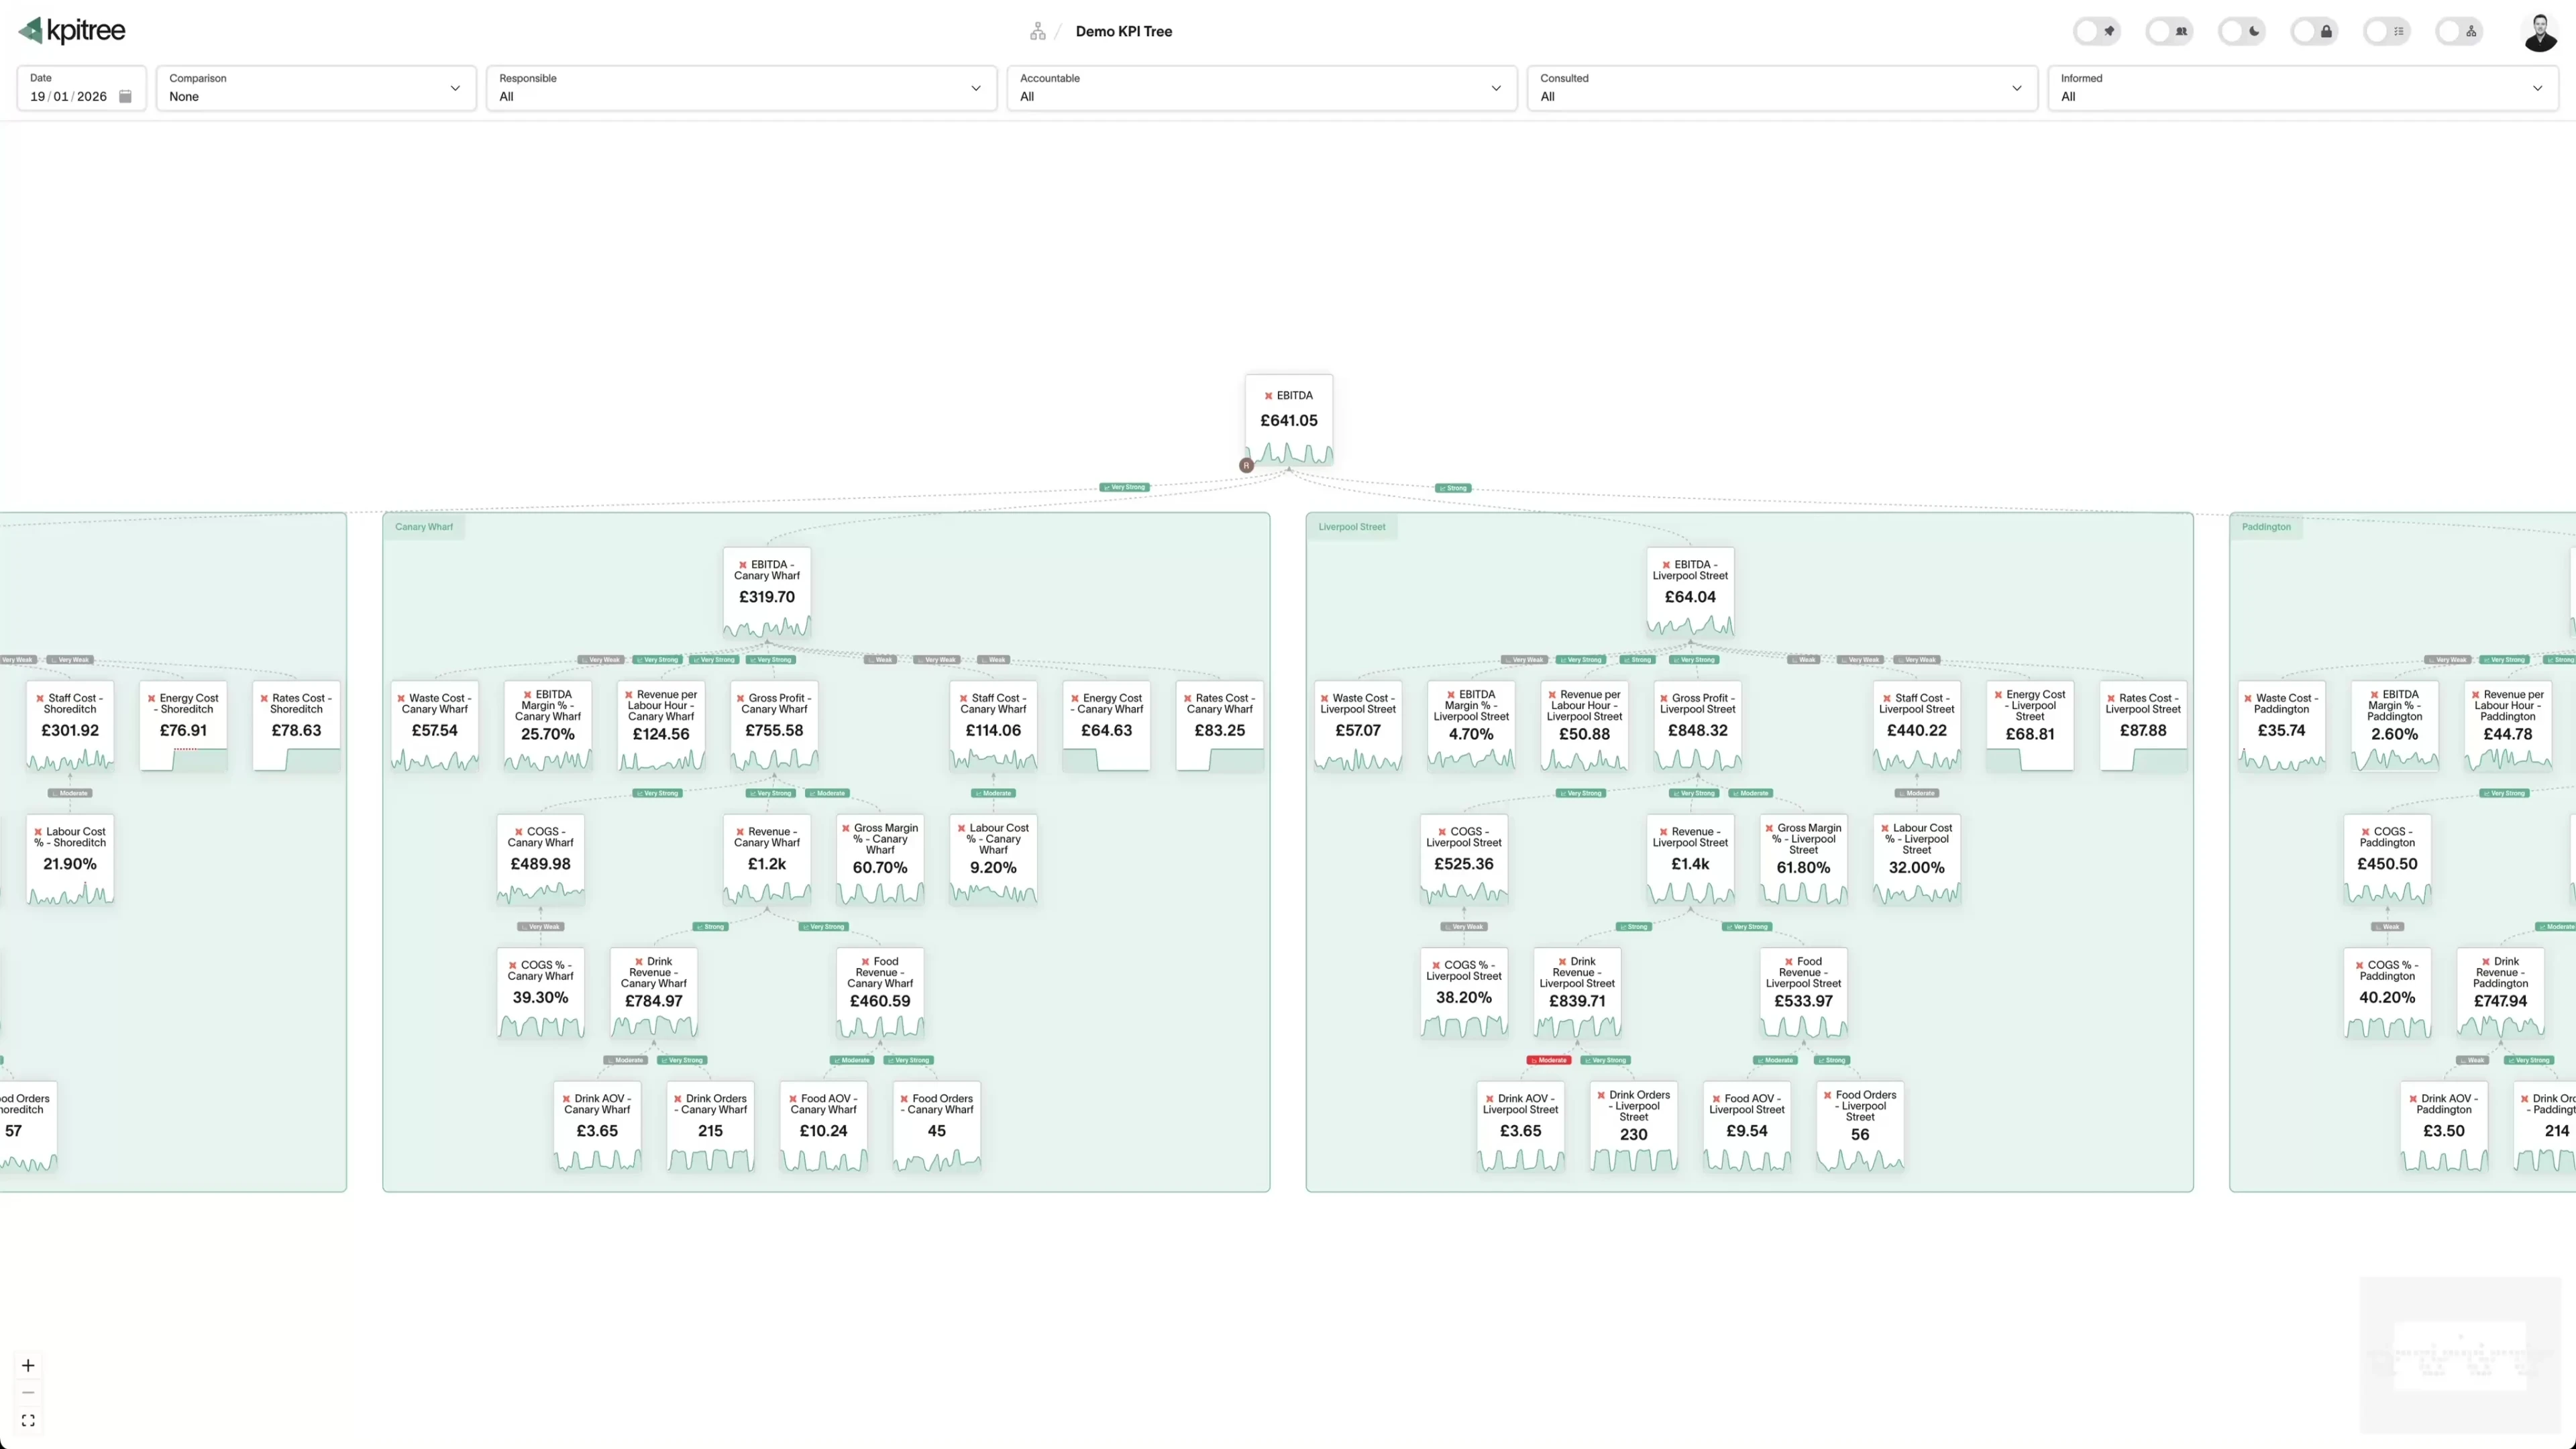
Decompose your P&L into a causal model
Build a metric tree that mirrors your P&L, then extends into the operational metrics that drive each line. Revenue breaks into channels, channels into volume and conversion, conversion into the activities that move it. Every relationship is a directed driver edge with a confidence level and statistical significance, tested against your data daily, and your team prunes the correlations that are coincidence. When a number moves, you follow the tree to find out why.
- Map every P&L line to the operational drivers beneath it, across sales, marketing, product and operations
- See a confidence level and statistical significance on every driver relationship, recalculated daily as new periods land
- Drill from a board-level variance to the team and activity that caused it
- Metrics stay current automatically, synced from your warehouse and semantic layer

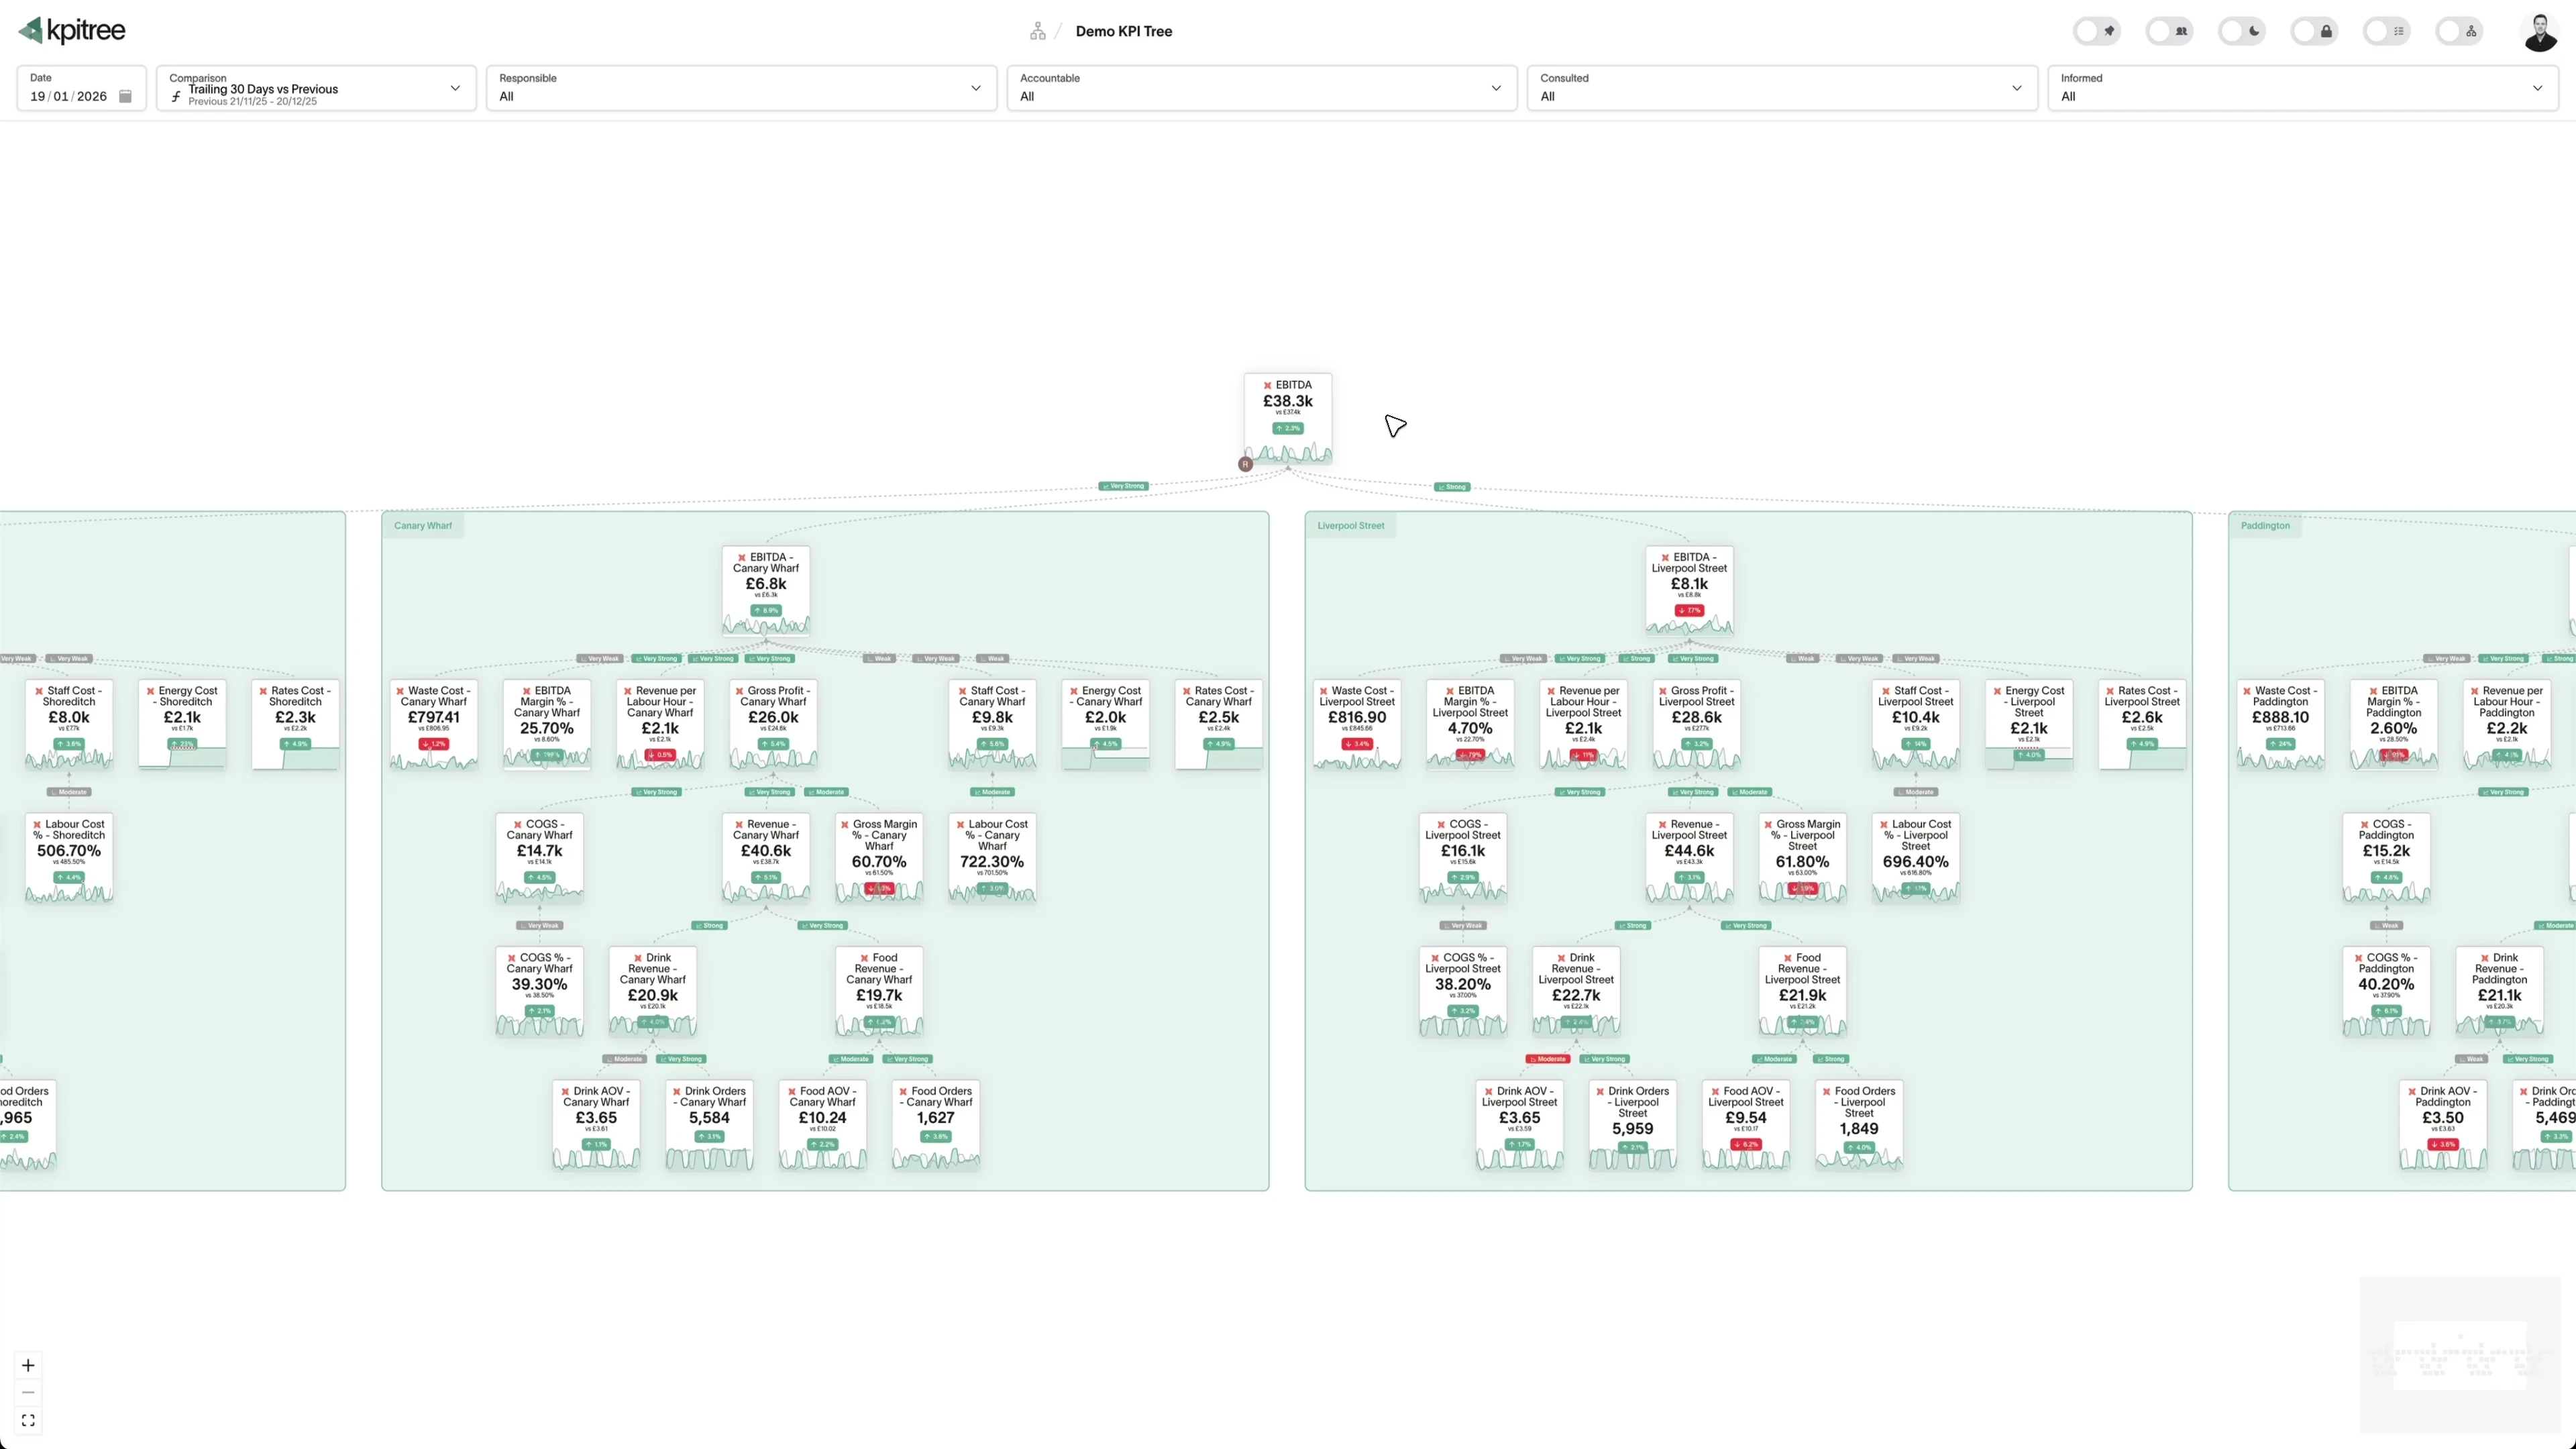
Run the plan through the same pipeline as the actuals
Business models hold your budgets, forecasts, targets and ramp profiles inside KPI Tree, aggregated by the identical calculation pipeline as your actuals. Plan and reality can never disagree about how they were computed, so a variance review starts at the variance rather than at an argument about the maths. And because both sides live in one model, your team, and the AI agents they use, get the same answer when they ask how performance stands against plan.
- Compare plan against actuals directly on the canvas, at any date, granularity or comparison period
- Model ramp profiles for new initiatives, so growth follows a realistic adoption curve rather than a flat assumption from day one
- Switch to the grid view when you want rows and columns, a familiar spreadsheet layout with the comparison at every date
- One calculation pipeline computes both plan and actuals, so no meeting opens with whose number is right
Break any variance into the drivers that caused it
When a metric misses, a waterfall chart breaks the movement into what each driver contributed, colour-coded by whether it helped or hurt. From there you trace the chain level by level to the operational input that actually moved, with confidence levels and statistical significance attached at every step. The follow-up you used to owe the board is already on the canvas.
- Waterfall charts show what each driver added to or took away from the variance
- Trace a miss through every level of the tree to the input that moved, not just one hop
- Driver contributions carry confidence levels and statistical significance, so you can say how sure the model is
- Distinguish an isolated blip from a systemic shift building across several levels of the tree
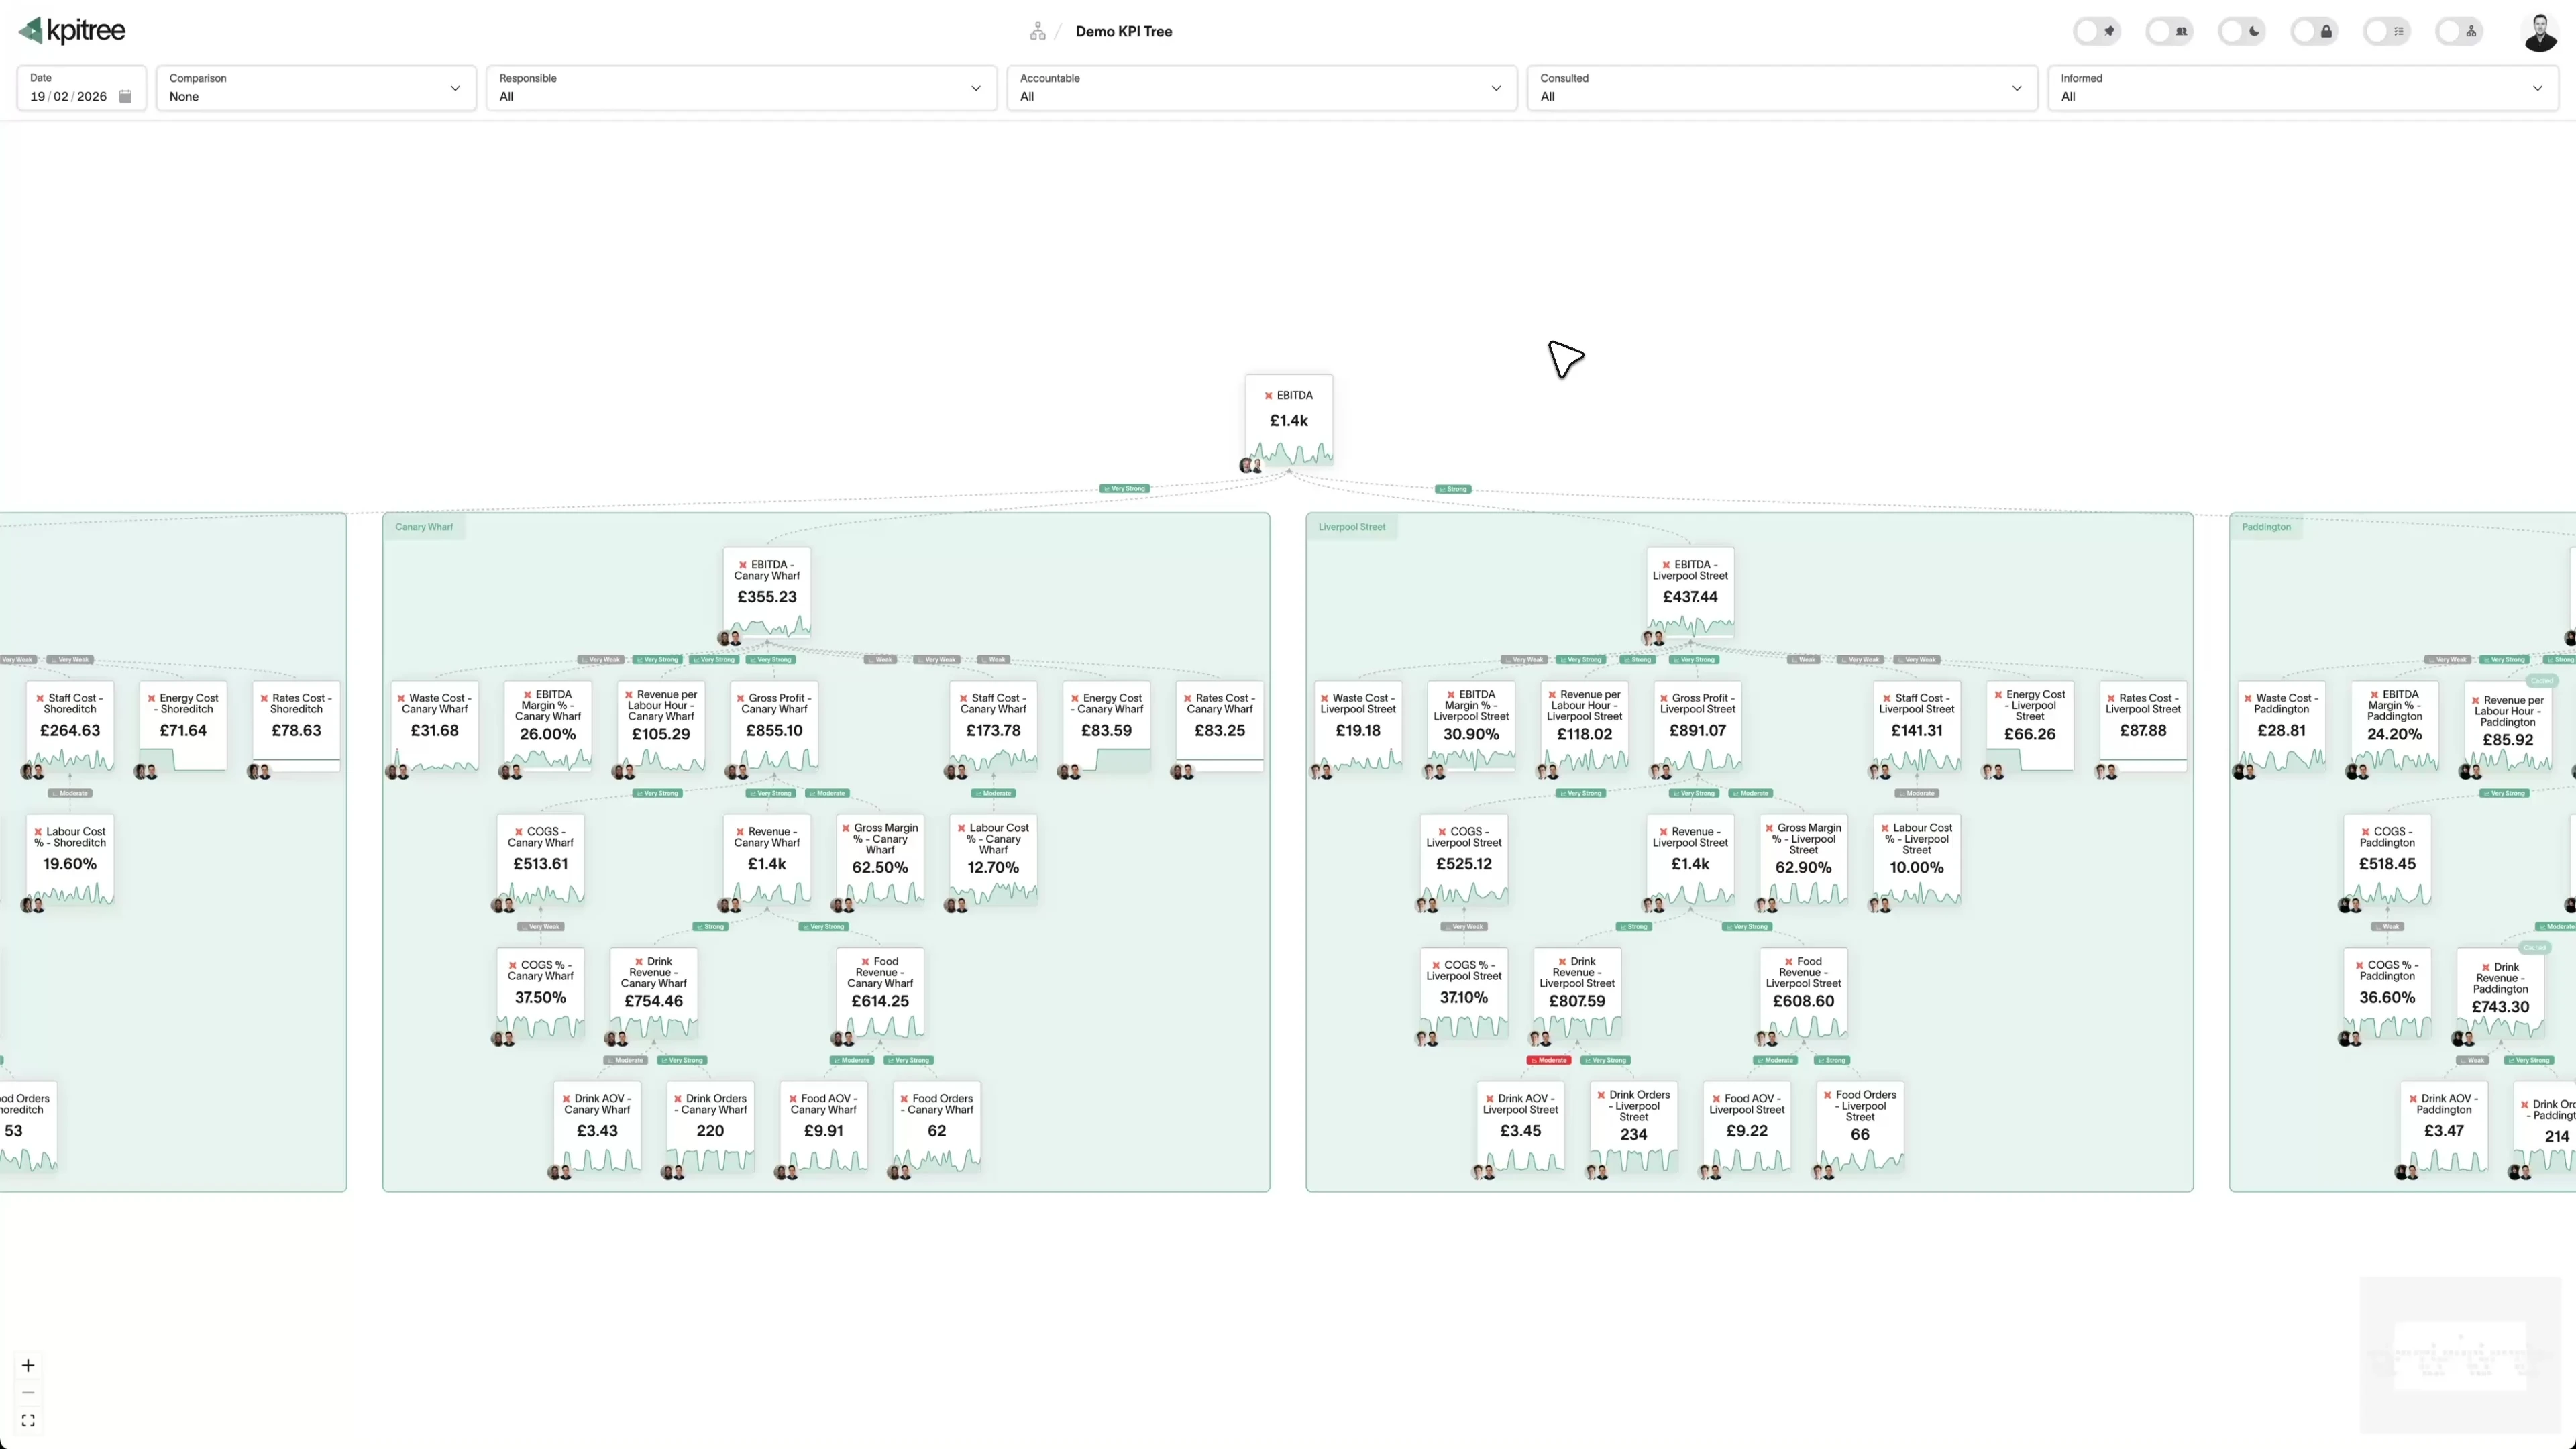
Close the period and the misses route themselves
Every metric carries RACI ownership, so a miss already has a name on it. A period-close trigger fires when a metric ends the period short of its target, within a tolerance you set, and notifies the named Accountable owner with the drivers attached. Workflows carry the response from there: approvals are first-class steps, escalation follows your live org chart, and every action is tracked against the metric it was meant to move, with the impact verified against the numbers at the next close rather than taken on trust. When the response is funded work, initiatives carry their budget and spend, and the Portfolio view shows whether the money moved the metrics it targeted.
- Period-close triggers fire when a metric misses its target and notify the named Accountable owner, not a channel
- Approvals are first-class workflow steps, so the next action only runs once the named reviewer signs off
- Escalation moves up the live org chart automatically when nobody acts
- Actions are tracked against the metric they were meant to move, and the impact is verified rather than self-reported
“Your FP&A tool holds the plan. Your BI tool reports the actuals. Neither can break the variance into drivers, put a named owner on the miss, or prove the fix worked.”
Beyond variance reporting
Spreadsheets and BI dashboards are built to report the numbers. They flatten your P&L into rows and charts with no explicit connections, no plan context and no owners. KPI Tree gives finance a causal model of the business that is measured, owned and verified.
Causality with the workings shown
Every relationship in the tree carries a confidence level and statistical significance, statistically proven over time rather than asserted in a meeting. Your team prunes the false positives, so what remains is a model you can stand behind when the board asks why.
One pipeline for plan and actuals
The same calculation pipeline that computes your actuals computes your budgets, forecasts, targets and ramp profiles, at every granularity and comparison period. Plan versus actual becomes a comparison, not a reconciliation project.
Misses that route themselves
When a metric misses its target at period close, crosses a threshold or goes quiet, the push goes to the named Accountable owner and escalates up the live org chart until someone acts. Finance stops being the chasing function.
Common questions
How does this connect to our existing financial data?
Is this a replacement for our BI or FP&A tools?
How do budgets and forecasts get into KPI Tree?
What happens when a metric misses its target at period close?
Can we see whether the money we spent actually moved the numbers?
Can we model different P&L structures for different business units?
Related guides
Metric trees for finance teams
From DuPont analysis to modern decomposition
How to set KPI targets
A data-driven approach to target setting
How to run a quarterly business review that changes what happens next
Most QBRs are backward-looking slide decks. The best ones are forward-looking decision sessions.
See your plan and your actuals in one causal model
Book a demo and we will map your P&L as a metric tree. You will see budgets and actuals computed by one pipeline, a variance broken into driver contributions on a waterfall chart, and a period-close miss routed to the named Accountable owner with the drivers attached.