
You shipped the roadmap. The north star did not move.
Product teams are measured on outcomes but run on outputs. The gap between the two is invisible in a product analytics tool, and it is where quarters get lost.
The north star dips and the meeting fills with theories
Activation looks soft, a release went out on Tuesday, marketing changed a campaign, and everyone has a story that fits. Without driver relationships that carry confidence levels and statistical significance, the argument about why is settled by seniority rather than evidence, and the same argument happens again next month.
Shipped is not the same as worked
The roadmap review counts delivered projects. But a feature can ship on time, spike adoption for a fortnight, and leave retention exactly where it was. If nobody measures each bet against the metric it was meant to move, the team learns nothing from a quarter of work, and the next roadmap is built on the same guesses.
Your metric tree stops at the product wall
Some analytics tools now draw metric trees, but they scope them to product events: funnels, cohorts, feature adoption. Your north star does not live in a vacuum. It connects to marketing acquisition, sales conversion, pricing and the P&L. A tree that only covers product is a branch pretending to be a forest.
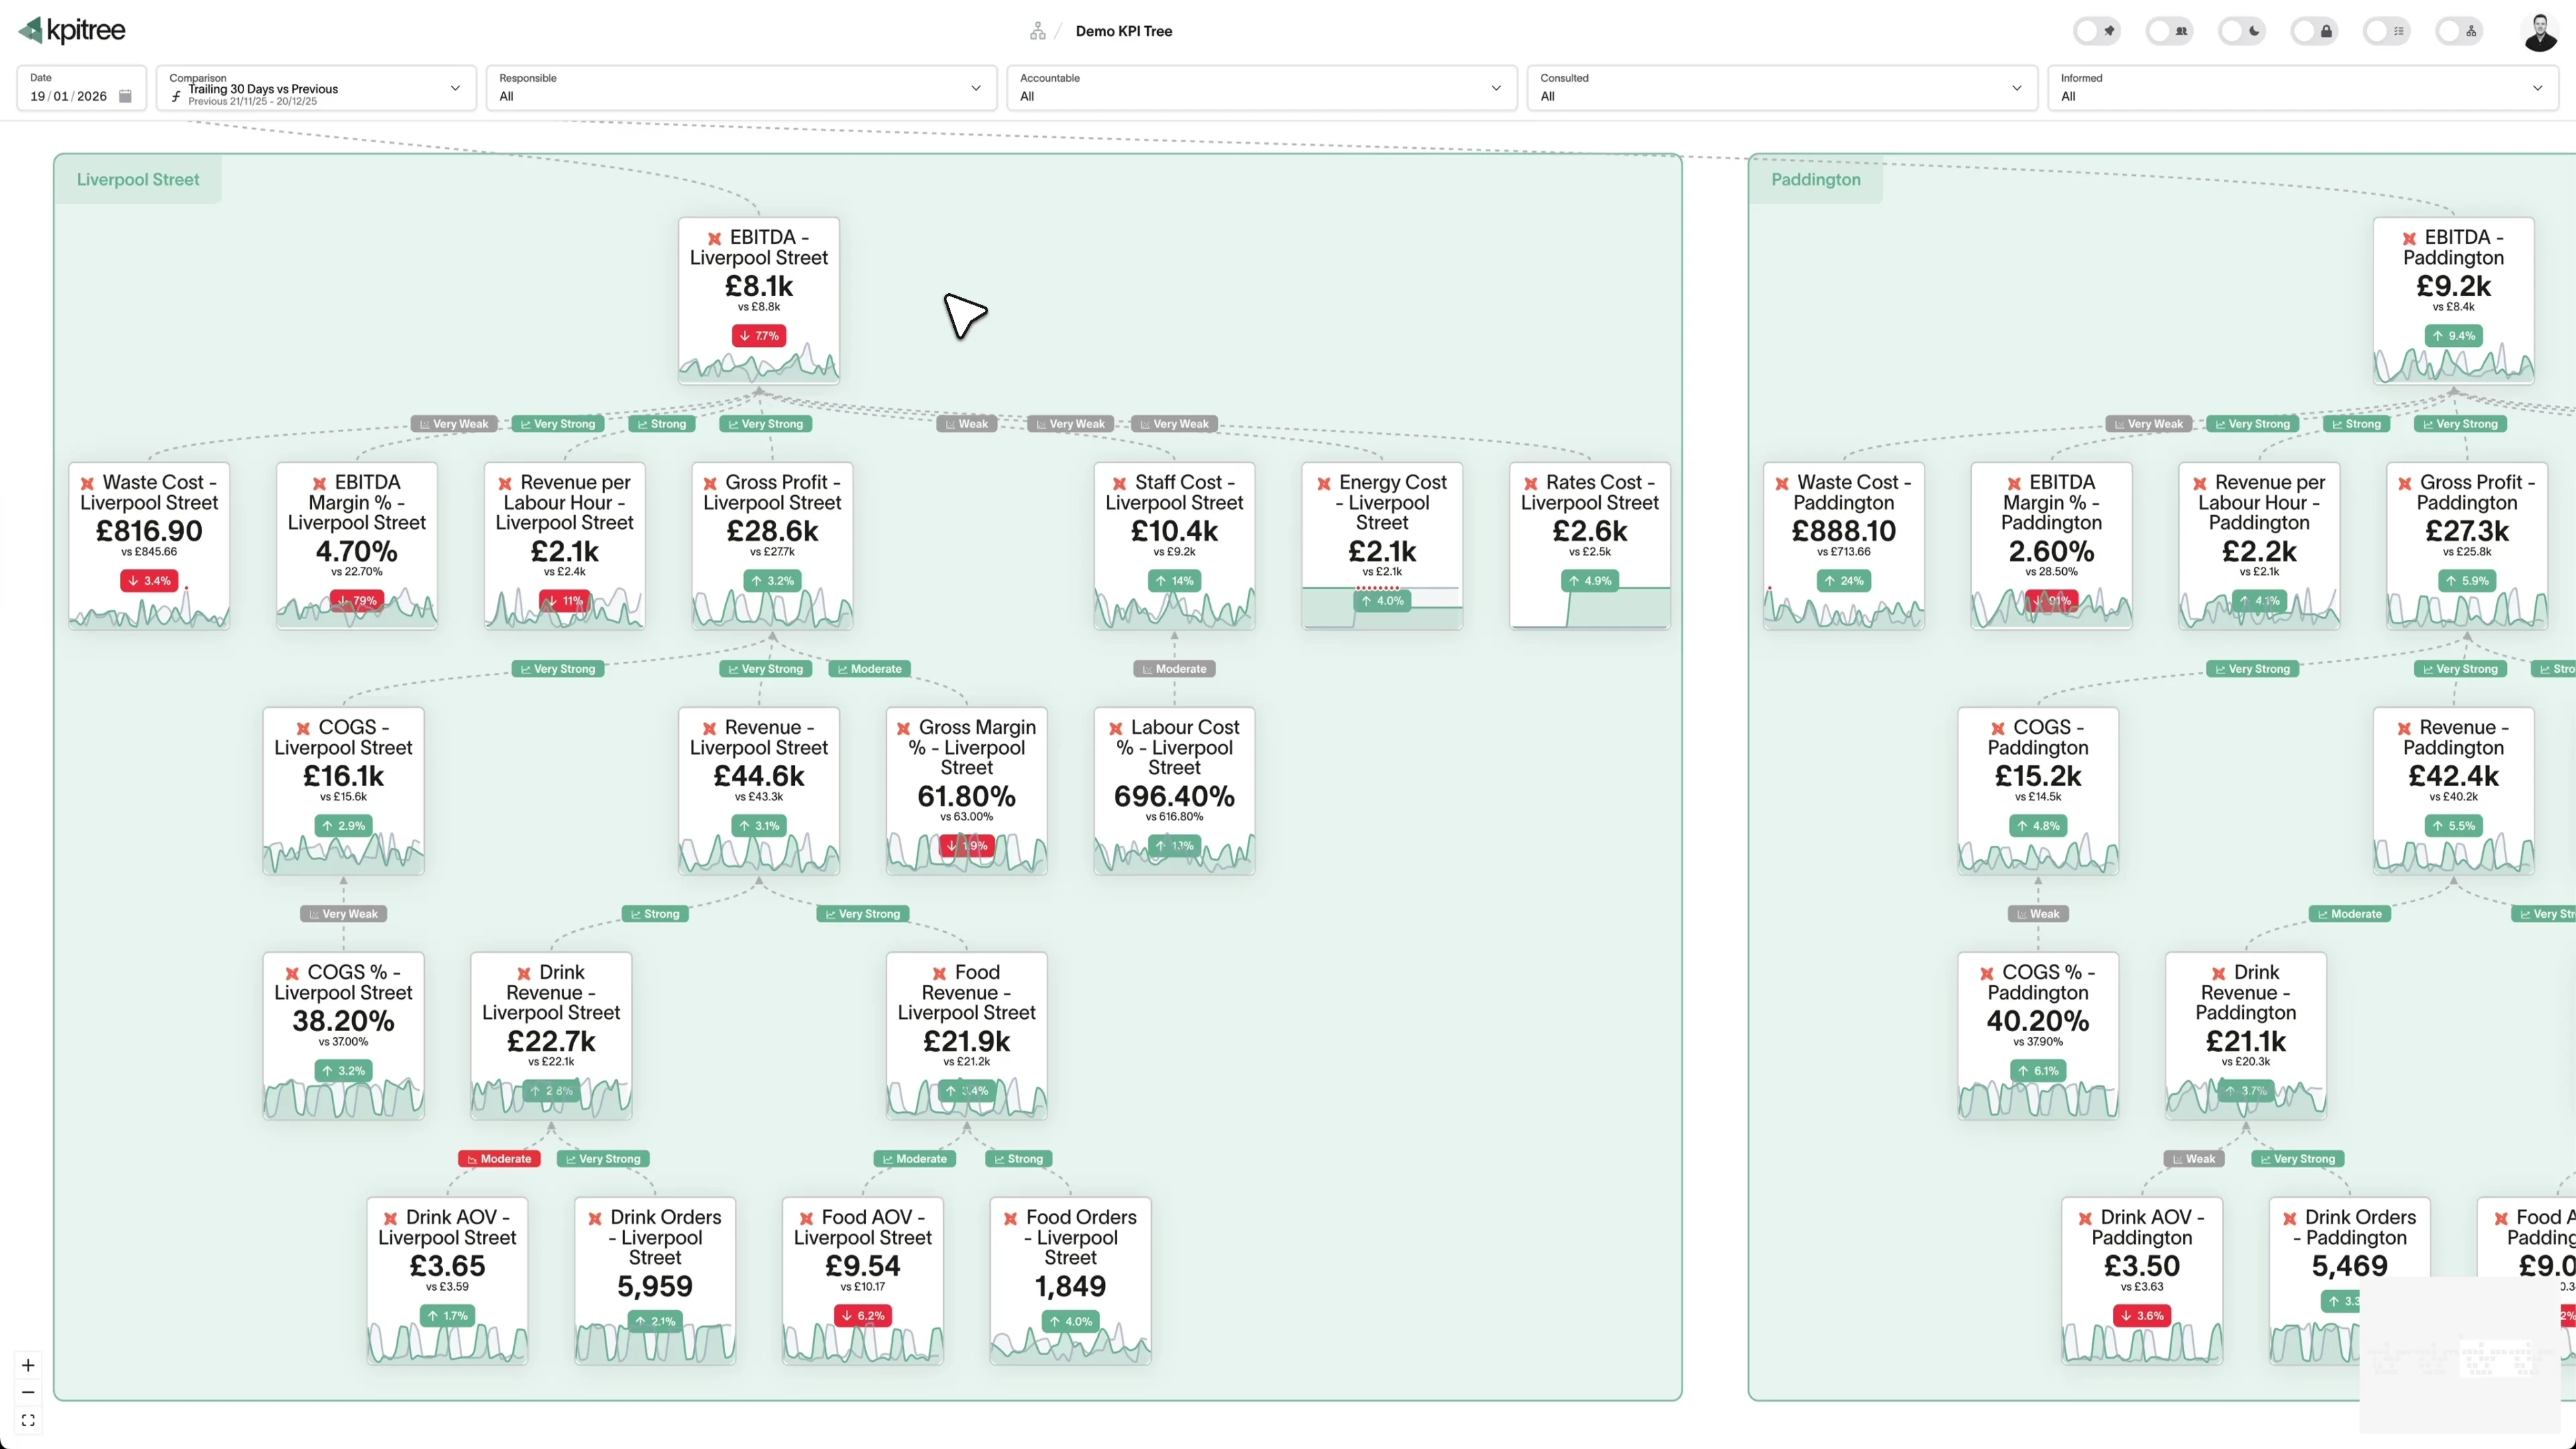
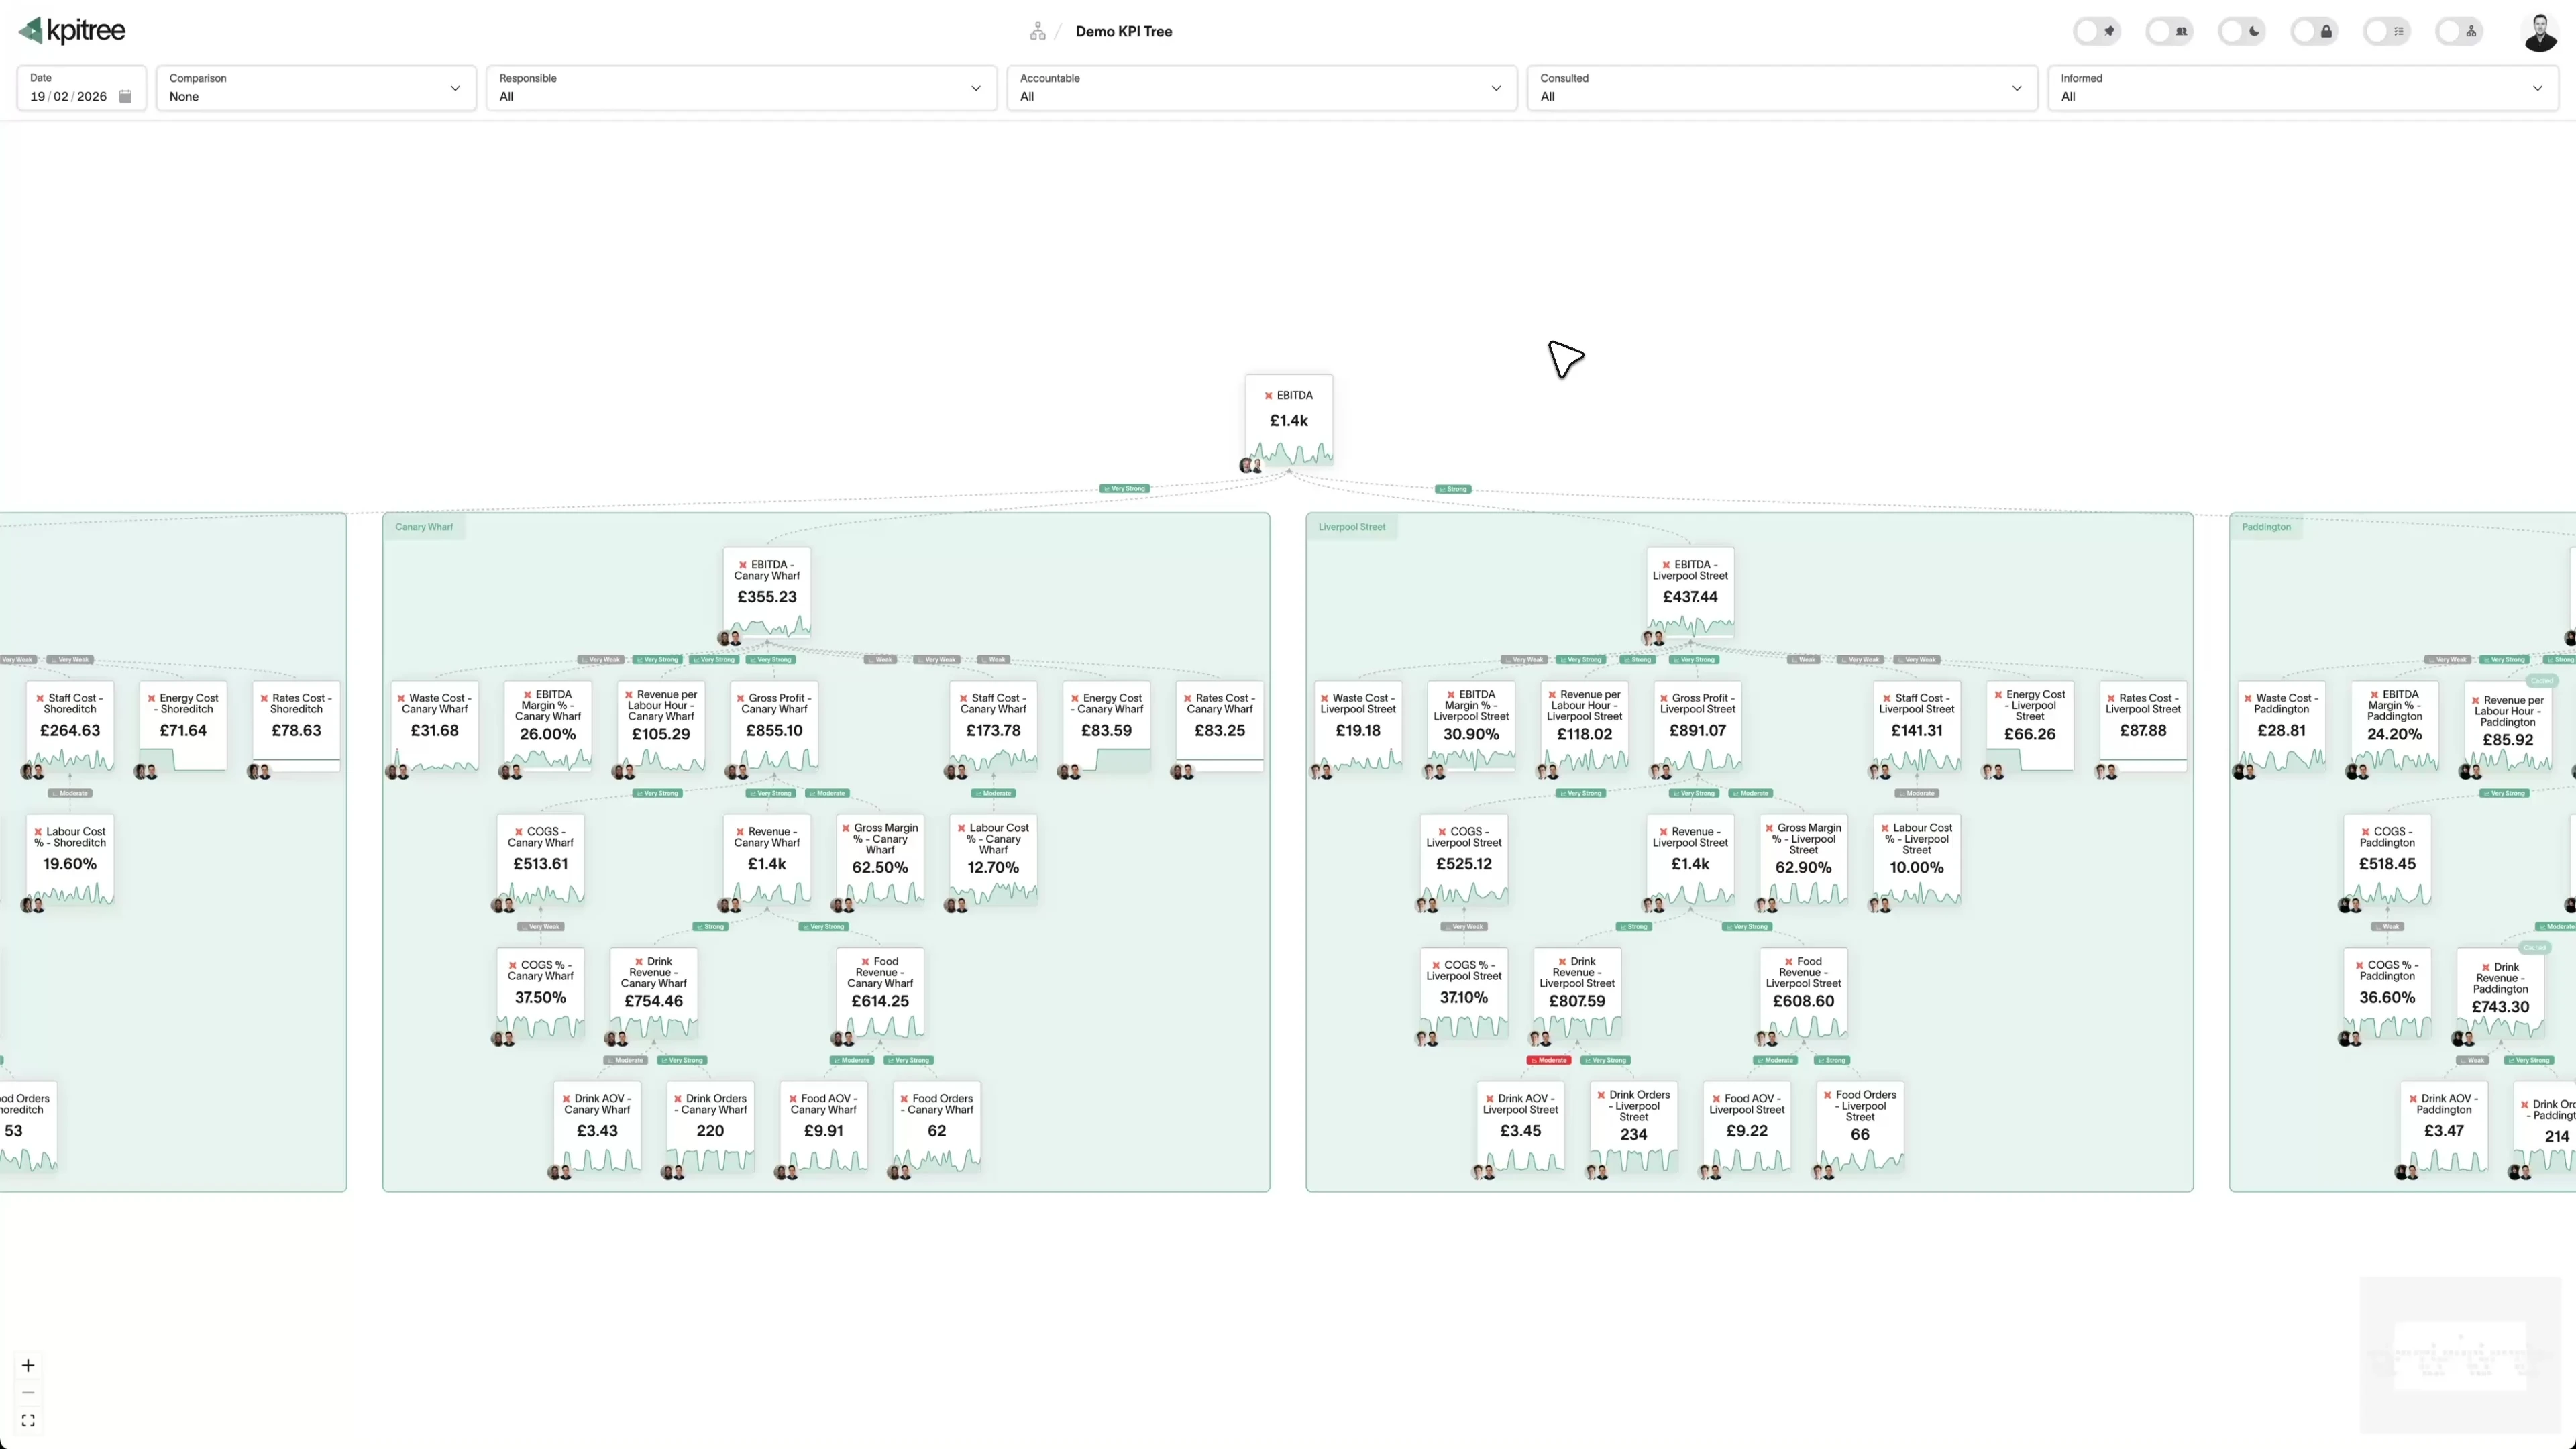
Decompose your north star into drivers you can defend
Start with your north star and break it down through activation, engagement, retention and monetisation, then keep going into marketing, sales and revenue. Every edge in the tree carries a confidence level and a statistical significance score, tested against your data daily, so the relationship between onboarding completion and retention is a measured claim rather than a diagram. AI drafts the structure, your product team reshapes it, and the daily tests decide which edges stay.
- Describe your product model in plain English and AI drafts the tree, with every node and edge editable
- Break each level into feature inputs: onboarding completion, core action frequency, time to value
- Connect product metrics to marketing, sales and revenue on the same canvas, so the tree does not stop at the product wall
- Every driver edge carries confidence and significance, recalculated daily, with false positives pruned by your team

Know why the metric moved before the stand-up does
When retention dips, KPI Tree ranks the drivers behind the change by impact, each with the confidence level and statistical significance to back it, and traces the movement through the tree to the input that actually moved. Ask a question that crosses team boundaries, like what is driving the activation decline across regions, and AI analyses the whole tree, querying your warehouse directly so the answer comes from your actual data rather than a plausible story.
- Drivers are ranked by impact, with confidence levels and statistical significance on every relationship
- Waterfall change insights show what each driver added or removed against its goal
- Cross-domain AI analysis connects insights across product, marketing and finance in one answer
- AI investigations query your warehouse directly, so findings are grounded in the underlying data, not just aggregated values
Give every driver a named owner and a push that fires when it moves
Shared ownership means no ownership. KPI Tree applies RACI to every metric in the tree, synced from your directory, so activation, onboarding and referral each have a named Accountable owner. When a metric crosses a threshold, produces an outlier, goes silent or misses its end-of-period target, the push fires because the metric itself moved, and it routes to that named owner via Slack, email, WhatsApp or SMS with the driver behind the movement attached.
- Assign squads or individuals to any node: the activation squad owns onboarding, the growth squad owns referral
- Triggers fire on threshold crossings, outliers, silent metrics and missed period-close targets, and each push routes to the named Accountable owner
- Escalation follows your live org chart, so a movement nobody acts on reaches the manager automatically
- Ask KPI Tree in Slack why activation dipped and the answer lands in the thread, with the driver and the owner attached
Run the roadmap as a portfolio of verified bets
Plan the work as initiatives, each linked to the metrics it is meant to move, with an owner, milestones, budget and spend. Execution is tracked separately from outcome, so a project delivered on time against a flat metric is visible at a glance rather than hidden behind a single progress bar. When objectives sit above the work, each key result is a real metric with a target, so progress is read from the data rather than typed into a status field. Impact is verified from the data, and the portfolio view shows which bets are working.
- Link every initiative to the metrics it targets, and track execution apart from outcome
- Impact is measured by the same pipeline that calculates your actuals, so nobody marks their own homework
- The portfolio view scores each initiative by how far its metrics have moved since the work began, in the direction it intended
- Model a launch with ramp profiles instead of flat assumptions, and compare the plan against actuals at any granularity
“Product analytics tools show you what users do. KPI Tree shows you what drives your north star with confidence and significance attached, who owns each driver, and whether the last release actually moved the number.”
What product analytics tools leave out
A metric tree you can look at is a feature. A closed loop that maps drivers with statistical confidence and significance, routes each movement to its named owner and verifies whether shipped work moved the number is a system. KPI Tree is the system.
The closed loop, delivered
A metric moves. The named Accountable owner is notified with the driver edge behind the movement attached. The action is tracked against the metric it was meant to move. The impact is verified weeks later by the same pipeline that calculates your actuals. Every vendor claims this loop. This is the mechanism.
Evidence that outranks seniority
Every relationship in the tree carries a confidence level and a statistical significance score, tested daily against your data for lag and seasonality, with false positives pruned by your team. When you argue for a bet on activation, the evidence is on the canvas, not in a slide.
AI answers with an owner and a track record
The same tree serves the people who own the metrics and the AI tools they already use. Over MCP, agents read significance-tested driver edges with their confidence levels, RACI ownership and verified impact history, so an answer arrives with an owner and a track record instead of a plausible story.
Common questions
How is this different from our product analytics tool?
Our analytics tool already draws metric trees. Why is yours different?
Is the driver analysis causal or just correlation?
Can we run our objectives and key results on it?
Can the AI tools we already use read the model?
What do we need in place to get started?
Related guides
Metric trees for product teams
Connect every feature, experiment, and initiative to the outcomes that matter
North Star Framework vs metric trees
Comparing and connecting two approaches to strategic measurement
How to run an A/B test with metric trees
Connecting experimentation to the metric tree framework
Bring your north star. Leave with its drivers.
Book an hour. We map your north star to the inputs that drive it, across product, marketing and revenue, with confidence and significance on every relationship, and show you the loop from a metric moving to a verified action. Your analytics stack stays exactly where it is.