
You are tracking everything and understanding nothing
Early-stage teams either measure too much or too little. Neither problem is about data. Both come from the absence of a model that shows how the numbers connect, who owns each one, and whether last month's work moved anything.
Twelve spreadsheets, zero agreement
Your metrics live everywhere. Marketing has one definition of "active users," product has another, and the board deck uses a third. When an investor asks a straightforward question, someone disappears for half a day. The answer changes depending on who pulls it.
Busy teams, flat numbers
Everyone ships. Everyone hustles. Revenue stays flat. The problem is not effort. The problem is that nobody can see which activity actually feeds growth, so people optimise the metric nearest to them without knowing whether it connects to the one that matters.
The model you raised on is not the business you run
Your fundraising model lives in a spreadsheet built the week of the raise, with ramp assumptions nobody has opened since. Your actuals live everywhere else. The two meet twice a year, in a board meeting, and every reforecast starts from a blank sheet because plan and reality share no common structure.
AI drafts your tree. You correct it. Evidence decides.
Most founding teams never build a driver tree because the workshops it used to take never fit the calendar. With KPI Tree you explain the business in plain English and AI drafts the metrics, the levels and the relationships between them in minutes. The draft is only the opening move: your team corrects every node and edge with what only founders know, and from then on your data is the judge, testing every relationship daily with a confidence level and statistical significance.
- Explain the business in plain English and AI drafts the metrics, drivers and relationships in minutes.
- Every node and edge stays editable, so the founding team can reshape the draft before the evidence takes over.
- Driver relationships are tested against your data daily, each carrying a confidence level and statistical significance.
- Start with manual inputs or Google Sheets and connect a warehouse when you have one.

Build the execution culture before headcount forces process
At eight people, accountability is a stand-up. At thirty, it is whoever spoke last, and you find yourself hiring someone to install process. KPI Tree runs the loop from day one: when a metric itself moves, on a threshold cross, an outlier or a metric that goes silent, the named Accountable owner is notified with the driver behind the move attached, complete with its confidence level and statistical significance. The action is tracked against the metric it was meant to move, and the impact is read from the metric itself, not from whoever wrote the retro. The culture forms around evidence while the team is still small enough to set it.
- Every metric has a named Accountable owner, visible on the tree before you have managers to enforce it.
- When a metric itself moves, the named Accountable owner is notified in Slack or by email with the driver behind the move, complete with confidence level and statistical significance.
- Actions are tracked against the metric they were meant to move, and the metric decides whether they worked.
- New hires read the tree and understand how the business works in their first week.
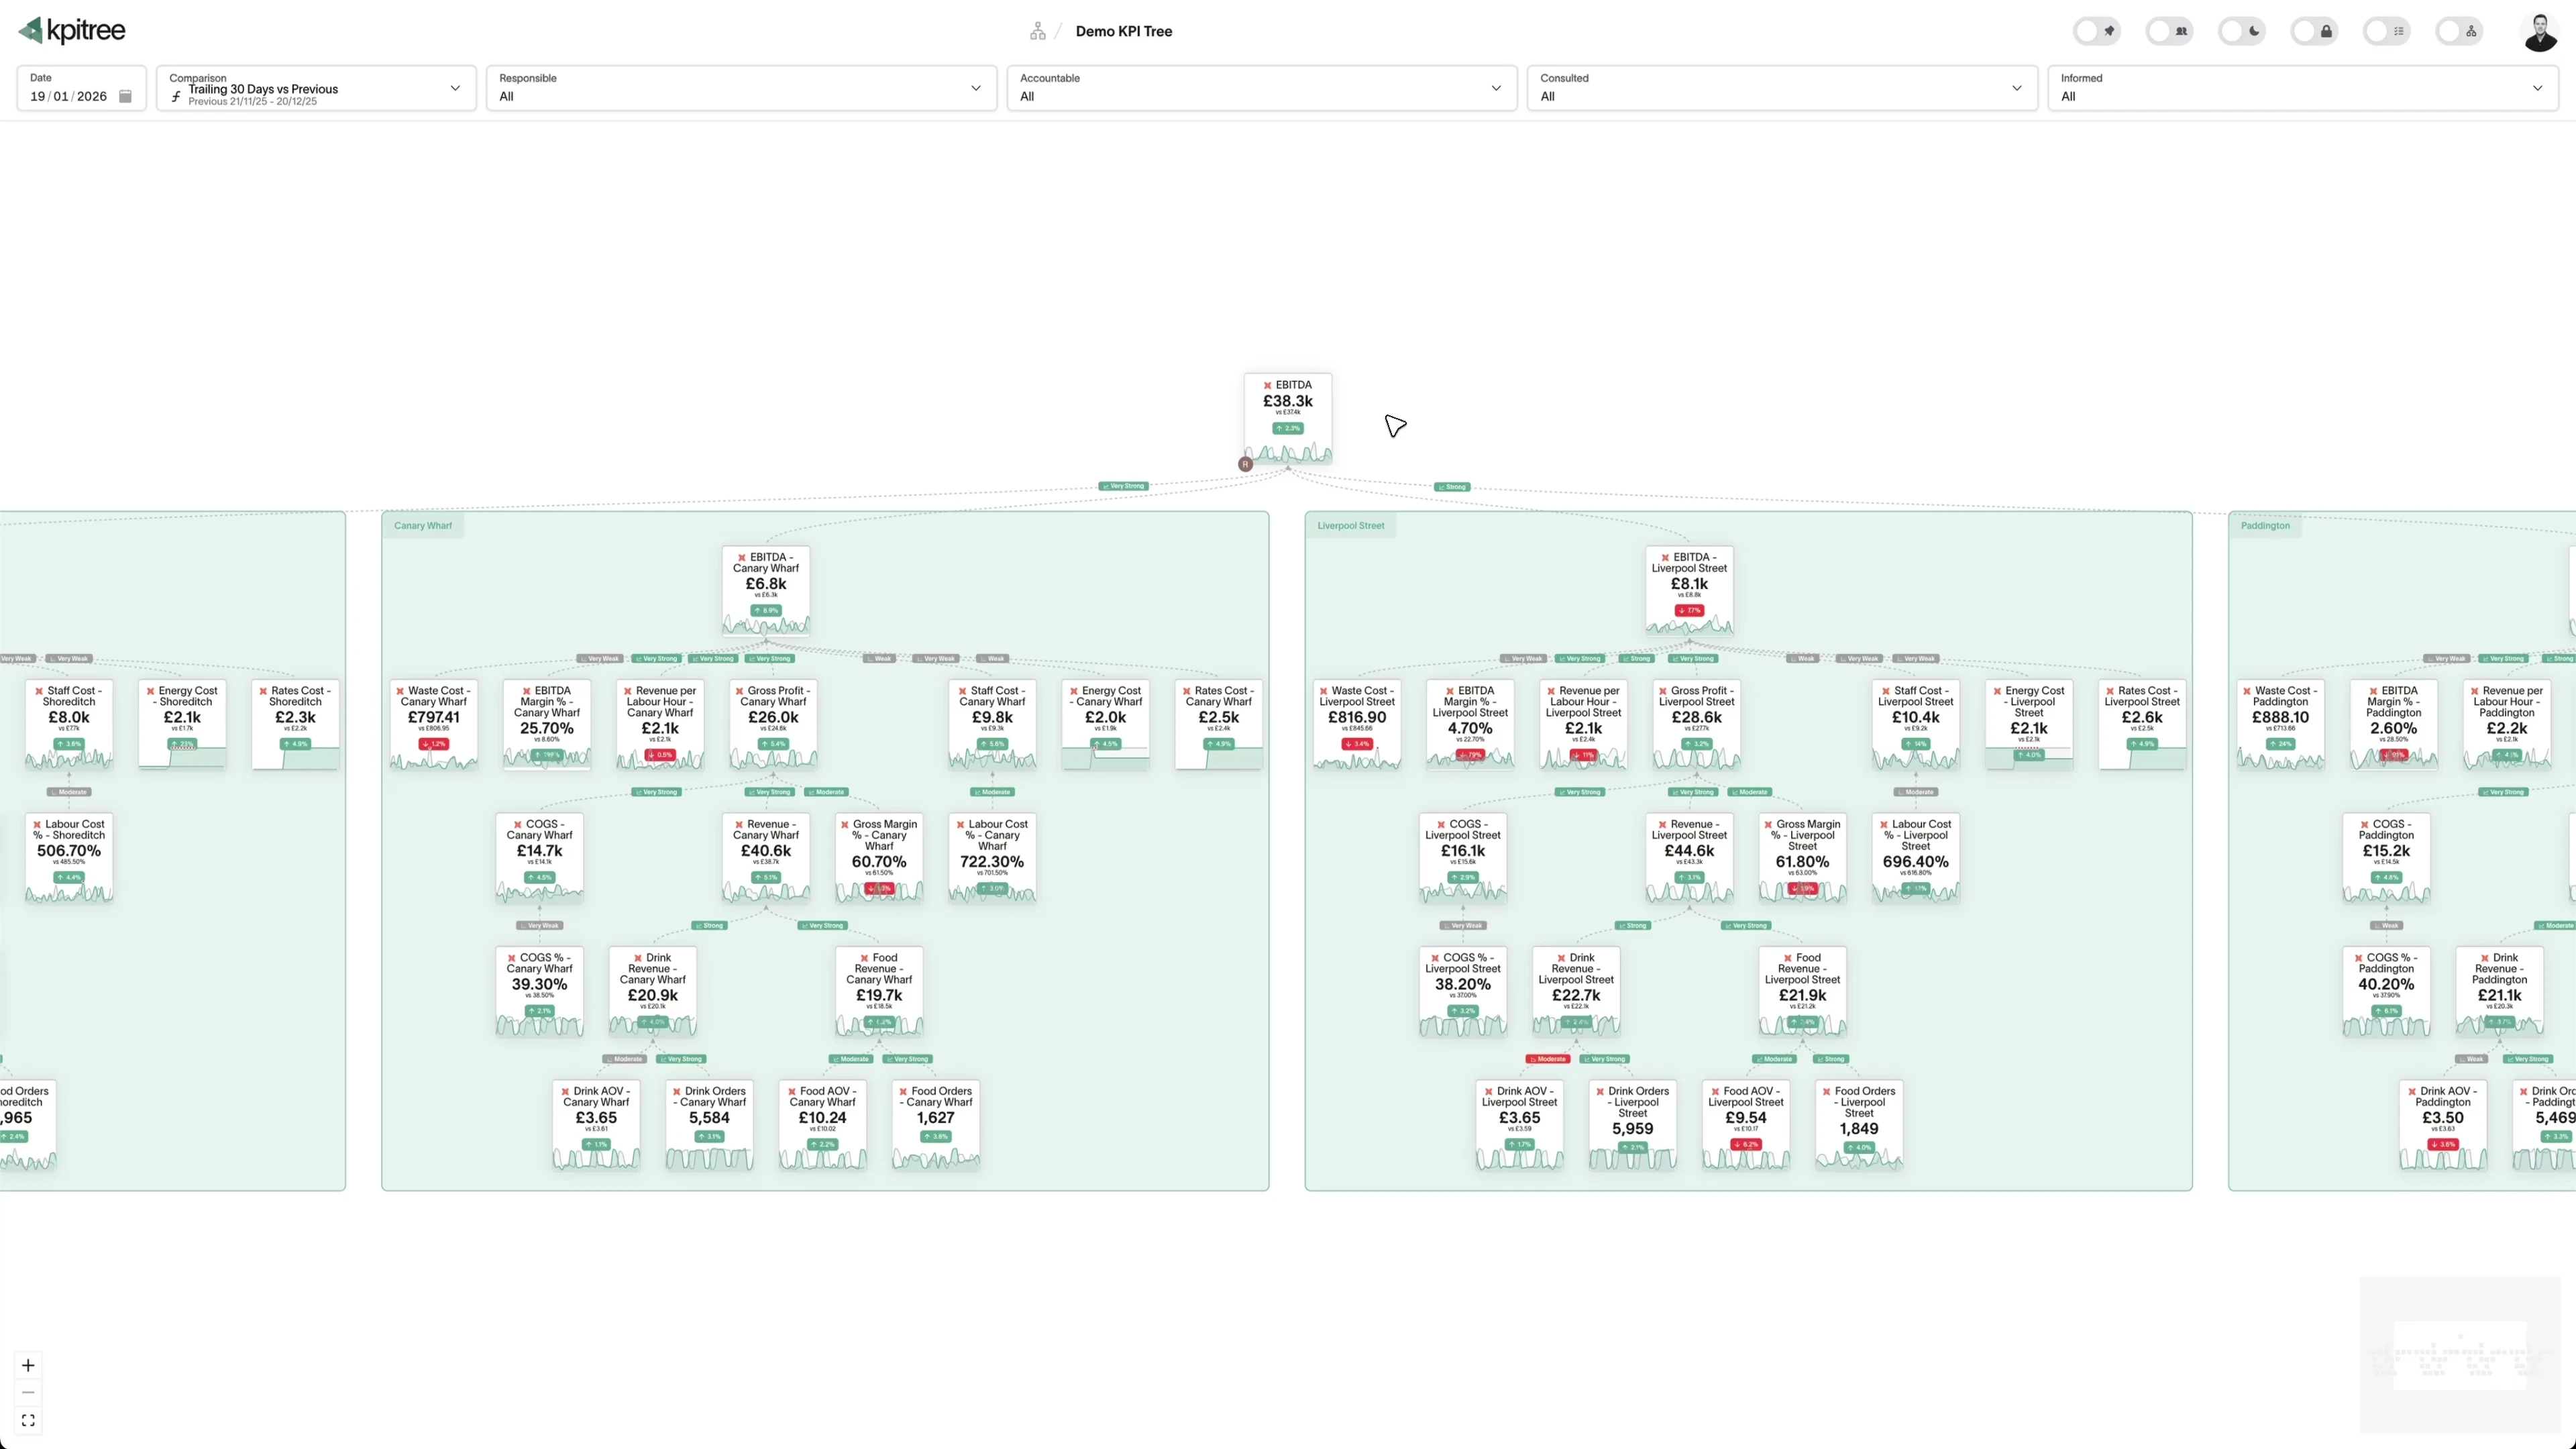
The fundraising model and the operating reality, in one place
Business models put your budgets, forecasts and targets on the same tree as your actuals, aggregated through the same pipeline, so plan versus reality is answerable on the canvas at any granularity and over any comparison period. Ramp profiles let each metric follow a realistic adoption curve instead of a flat assumption, which is how growth actually arrives. The model you show investors and the numbers you run the company on stop being two files that quietly disagree.
- Budgets, forecasts and targets flow through the same pipeline as your actuals, so plan and reality never disagree about the calculation.
- Ramp profiles give each metric a realistic adoption curve instead of a flat assumption from day one.
- Compare plan against actuals across any period, granularity or comparison frame directly on the canvas.
- The board sees the same numbers you run the company on, because both live in one system.
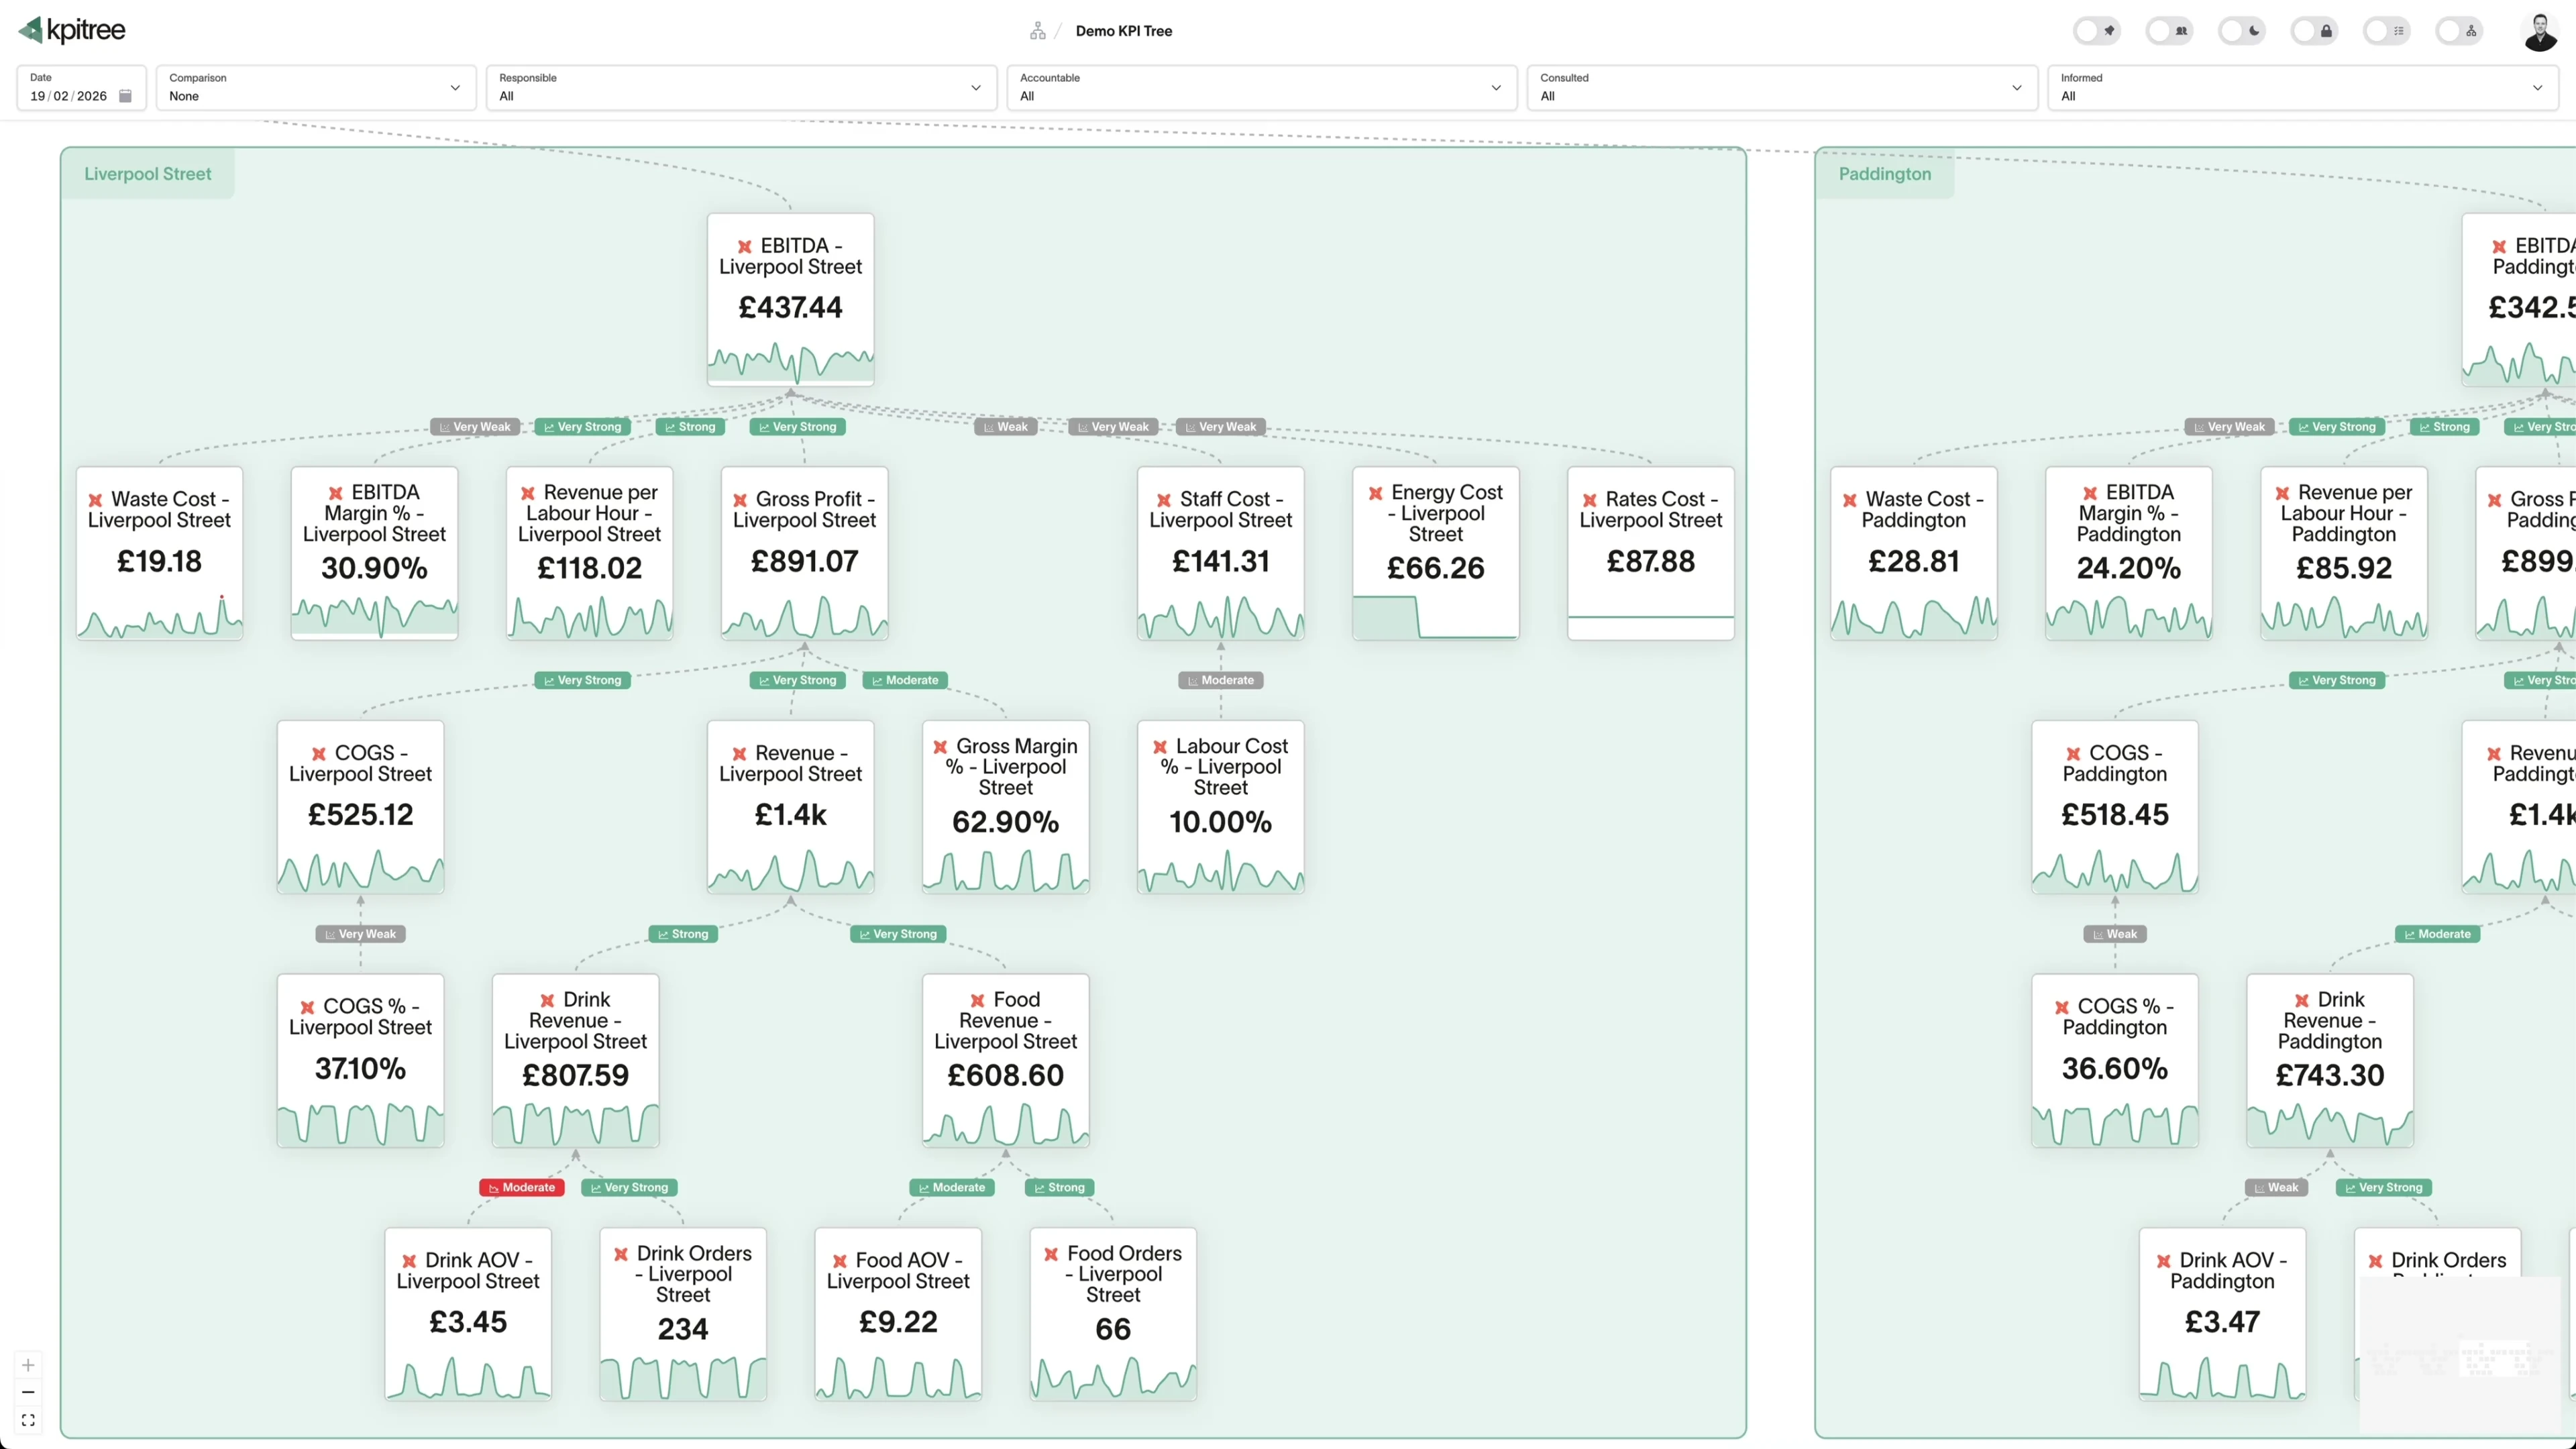
Show investors a system, not a slide
Investors have heard a thousand growth narratives. What they rarely see is a founder who can walk them down the tree: what drives retention, stated with a confidence level and statistical significance rather than conviction; who owns each number; and which past actions verifiably moved it. A slide claims execution. A verified impact history is evidence of it.
- Answer "what drives your retention?" with driver relationships that carry confidence levels and statistical significance, not a narrative.
- Walk the chain from daily activity to revenue, with a named owner on every metric along it.
- Show the verified impact history of what the team shipped and what it moved, which is evidence of execution rather than a claim of it.
- Export your tree for board decks and investor updates.
“Spreadsheets hold the numbers. The board deck holds the story. Neither shows what drives what, who owns it, or whether last month's bet moved anything.”
Built for the team you have, sized for the one you are hiring
You do not have a data team, and you do not have a quarter to spend on implementation. KPI Tree works the way a startup works: drafted in minutes, useful from day one, and structured so the system you build now is still the system at a hundred people.
Live in minutes, not quarters
AI drafts the tree from a plain-English description, and manual inputs make it useful before a single source is connected. There is no integration marathon and no data team prerequisite. Your spreadsheets stay; the tree gives them structure.
Your AI assistants read the same tree you do
The tree your team works from is the same business context your AI agents consume. Canopy, KPI Tree's business context layer, serves every agent what drives each metric with its confidence and statistical significance, who owns it, and whether the last action worked, over MCP. You do not buy another chat tool; the assistants you already use start answering with your drivers, your owners and what actually worked.
Room to grow without a rebuild
Start with five metrics and a founding team. The same model scales to thousands of metrics per account without rebuilding, and large trees stay fast because the metrics on your screen load first. The tool that helps you find product-market fit is the one that runs the company that found it.
Common questions
We just use spreadsheets for tracking. Why would we switch?
Do we need a data warehouse or analytics stack?
Is this useful before we have product-market fit?
We just ask AI when we have a question about our numbers. Why maintain a tree?
How much does it cost for a small team?
How is this different from OKRs?
Related guides
Metric trees for startups
The right metrics at the right stage, from day one to Series A and beyond
North star metric: what it is and how to find yours
Choose the right north star metric and make it actionable
The metrics maturity model
Five levels from ad hoc reporting to optimised decision-making
Build the system before you scale it
Describe your business, correct the draft, and let the evidence decide. Get the loop running while the team still fits in one room, then walk into your next investor meeting with a system instead of a story.