
You invested in the data stack. The decisions did not improve.
Enterprise data infrastructure is sophisticated. The problem was never access. The problem is that nothing connects what happened to why it happened, who should act, and whether that action worked. AI made answers cheaper. It did not close that gap.
Every department has its own truth
Marketing measures leads. Sales measures pipeline. Finance measures revenue. Nobody can trace the causal chain between them, so when a number moves, the post-mortem is a room full of people pointing at different dashboards, each telling a different story about the same quarter.
Hundreds of metrics, no named owners
Your organisation tracks hundreds of metrics across dozens of teams. When something goes wrong, the first question is "whose metric is this?" and the answer takes longer than the fix. Metrics without owners are metrics nobody manages. They get reported on. They do not get improved.
AI agents are multiplying faster than governance
Every business unit is already pointing AI assistants at the data. Each one rebuilds its own picture of the business from scratch on every question, presents correlation as causation, and answers to nobody. Ten teams with ten agents produce ten explanations of the same revenue dip, with no owner, no audit trail, and no record of whether anything was done about any of them.
One causal model across every business unit
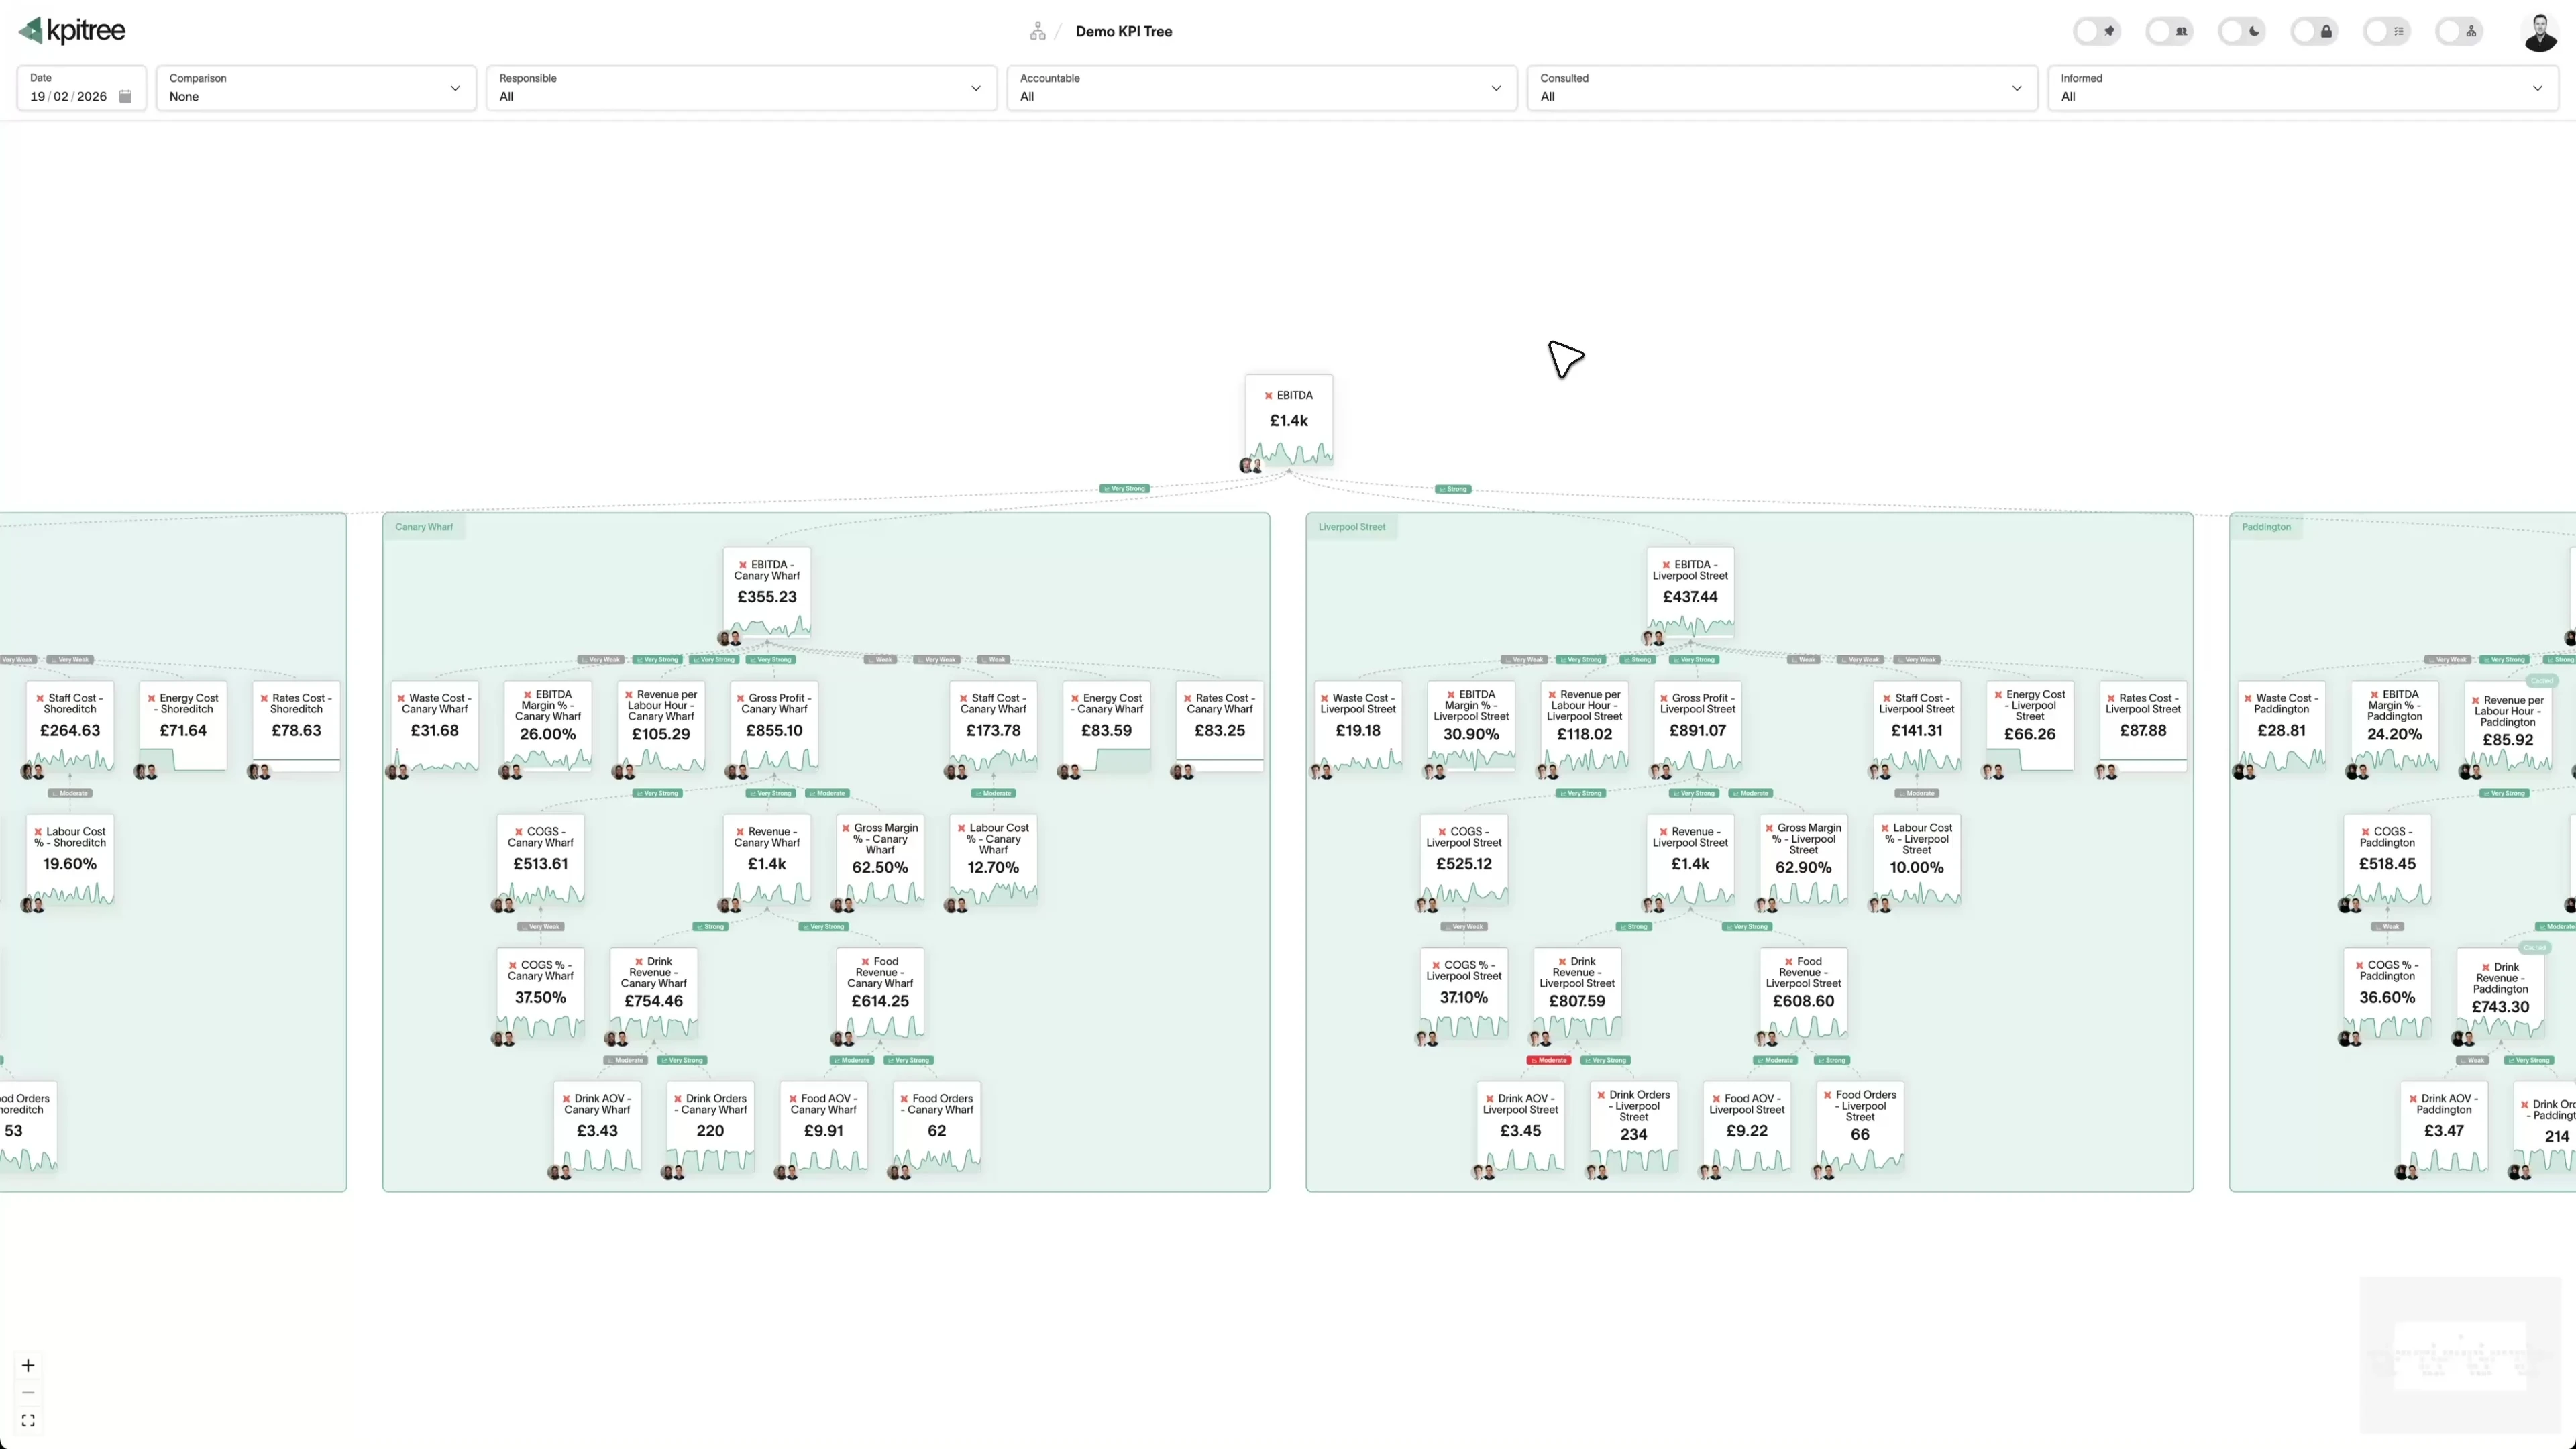
Define the metric taxonomy once and make it the shared language of the organisation. Every metric has a single canonical definition, a named owner, and a place in a causal structure where every relationship carries a confidence level and a statistical significance score, tested against your data daily. When the CFO says "revenue" and the VP of Sales says "revenue", they mean exactly the same thing, and the argument about why it moved happens in the model, not in a meeting.
- The model scales to 5,000 metrics per account, so every business unit fits in one causal structure rather than a tree per silo.
- Every driver relationship is statistically tested against your data daily, with its confidence and significance visible on the edge.
- Departmental trees keep their own structure, owners and thresholds, and roll up into a consolidated organisational view.
- Every change to definitions, ownership and structure is recorded and attributable.

Accountability that runs on your live org chart
Every metric has a named Accountable owner, with Responsible, Consulted and Informed alongside, synced from your directory provider and kept current as people join, move and leave. Manager assignments give KPI Tree your live org chart, so accountability always has somewhere to go next. When a metric crosses a threshold, throws an outlier, goes silent or misses its target at period close, the push routes to the named Accountable owner within minutes, carrying the driver edge that caused it, with its confidence and significance. If nothing happens, escalation policies walk the org chart automatically.
- RACI assignments on every metric, synced from your directory provider so ownership never goes stale.
- Notifications fire when the metric itself moves and go to the named owner via Slack, email, WhatsApp or SMS, not to a channel someone once configured.
- Escalation policies notify the manager, reassign up the reporting line and record every step, with approvals as first-class gates.
- Every action is tracked against the metric it targets, and its impact is verified by the same calculations that produce your actuals.
Every sanctioned agent, the same governed context
Canopy is the business context layer your agents read over MCP. Connect Claude, ChatGPT, Gemini, Copilot and the other MCP clients, and every one answers from the same governed model: driver edges with confidence levels and statistical significance, RACI ownership, budgets and targets, and the verified impact of past actions. Every answer respects the permissions of the person asking, so an agent sees exactly what its user sees. And AI stays under admin control: choose the models, bring your own API keys, cap daily spend per workspace, and switch on content moderation where your industry requires it.
- One-click MCP setup covers the assistants your teams already use, so there is no integration project per agent.
- Agents inherit the asking user's permissions on every run. There is no all-access service account.
- Admins manage agents and workflows centrally, and a shared run history records every run and what it cost.
- Precomputed metric context turns roughly ten agent queries per metric into one, and every calculation runs in KPI Tree's own compute engine, so the warehouse bill stays flat as agent use grows.
“Your warehouse knows what happened. Your semantic layer knows how it was calculated. Nothing in the stack knows why it moved, who is accountable, or whether the last action worked. That is the layer KPI Tree adds, for your people and every agent they use.”
Security and compliance without compromise.
Your governance requirements are non-negotiable. KPI Tree is built for organisations where security reviews are thorough and compliance is mandatory, on an architecture that fetches your data on the fly rather than storing it.
SOC 2® Type II
The gold standard for compliance. Unlike a point-in-time audit, Type II verifies our controls operate effectively over an extended period, independently examined for Security, Availability and Confidentiality.

SSO. One click, your identity provider.
Secure access through your identity provider. SAML 2.0 and OpenID Connect supported. Your team signs in with credentials they already have.


Directory sync. Users managed automatically.
Sync users directly from your corporate directory (Microsoft Entra ID, Okta, Google Workspace). Access is provisioned and deprovisioned automatically as your team changes.
Audit logs. Stream to your SIEM.
Stream user activity and security audit logs to your existing SIEM provider. Compatible with services like Datadog and Splunk for centralised monitoring and compliance.
Endpoint protection. Restrict access to approved IPs.
Restrict login attempts to your approved IP ranges only. If you use a service like Zscaler, access is limited to your secure network, preventing unauthorised access from outside.
HSM encryption. Hardware-backed, always encrypted.
By design we fetch your data on the fly rather than storing it. Anything temporarily cached is encrypted at rest using a Hardware Security Module (HSM).
BYOK. Bring your own key.
For customers in regulated industries, bring your own key to encrypt your data at rest with a key you control.
The missing layer in your data stack
Analytics platforms give you faster answers. KPI Tree gives your organisation the structural understanding of how metrics connect, who is responsible, and whether the actions being taken are making a measurable difference. We call the discipline Data Engagement: connecting data intelligence to human behaviour change.
Causal structure, not dashboards
A metric tree is a causal model of your business, and every relationship in it carries a confidence level and a statistical significance score from tests that run daily. AI proposes the structure, each business unit corrects its own tree, and the daily statistical tests arbitrate. When people see cause and effect instead of charts side by side, they reason about problems differently.
Accountable agents, not another assistant
Your people and your AI agents work from the same governed model. The choice is never our assistant or yours: Canopy makes the agents your teams already use accountable, so every answer carries the driver with its confidence and significance, the named owner, and the verified outcome.
Enterprise-grade from day one
SOC 2 Type II, SSO and directory sync, audit logs in your SIEM, and granular permissions down to tasks, objectives and API keys are already in place. Your security team will not need to make exceptions.
Common questions
We already have a semantic layer. What does KPI Tree add?
How does ownership work across hundreds of teams?
How do we keep AI use under control?
Can the AI assistants our teams already use connect?
What if different departments want different tree structures?
Does this replace OKRs?
Related guides
One governed model. Every business unit. Every agent.
Map the causal relationships between metrics across every department, each one carrying a confidence level and a statistical significance score, put a named owner on every metric, and give your people and your AI agents the same governed context, with the closed loop from insight to action to verified impact. Talk to our enterprise team.