
You have more data than ever. And less proof than you need.
Your BI tool shows what happened. Your AI assistant answers the question you asked. Neither names who acts when a number moves, and neither proves whether the action worked. That gap is where leadership time goes.
Six dashboards. Six different stories.
Finance has its dashboard. Sales has one. Marketing has three. Each tells a different version of reality, so the leadership meeting spends its first half reconciling numbers and its second half debating why they moved. No tool shows how the stories connect, so alignment eats the time the decisions needed.
Strategy in January. Drift by March.
You set the priorities and the targets in the first week of the year. By the second quarter, every team has interpreted them differently. Strategy lives in a deck, the work lives in project tools and spreadsheets, and there is no living chain connecting the target to the metrics that deliver it and the work funded against them. The gap between the plan and the business grows every week.
Everything shipped. The number did not move.
The quarterly review is a wall of green: every project delivered, every update positive, and the metric flat. The only record of whether actions worked is what people said in the retro, so you cannot tell which bets are failing and which have not had time to work. The same investments get defended with the same anecdotes, another quarter running.
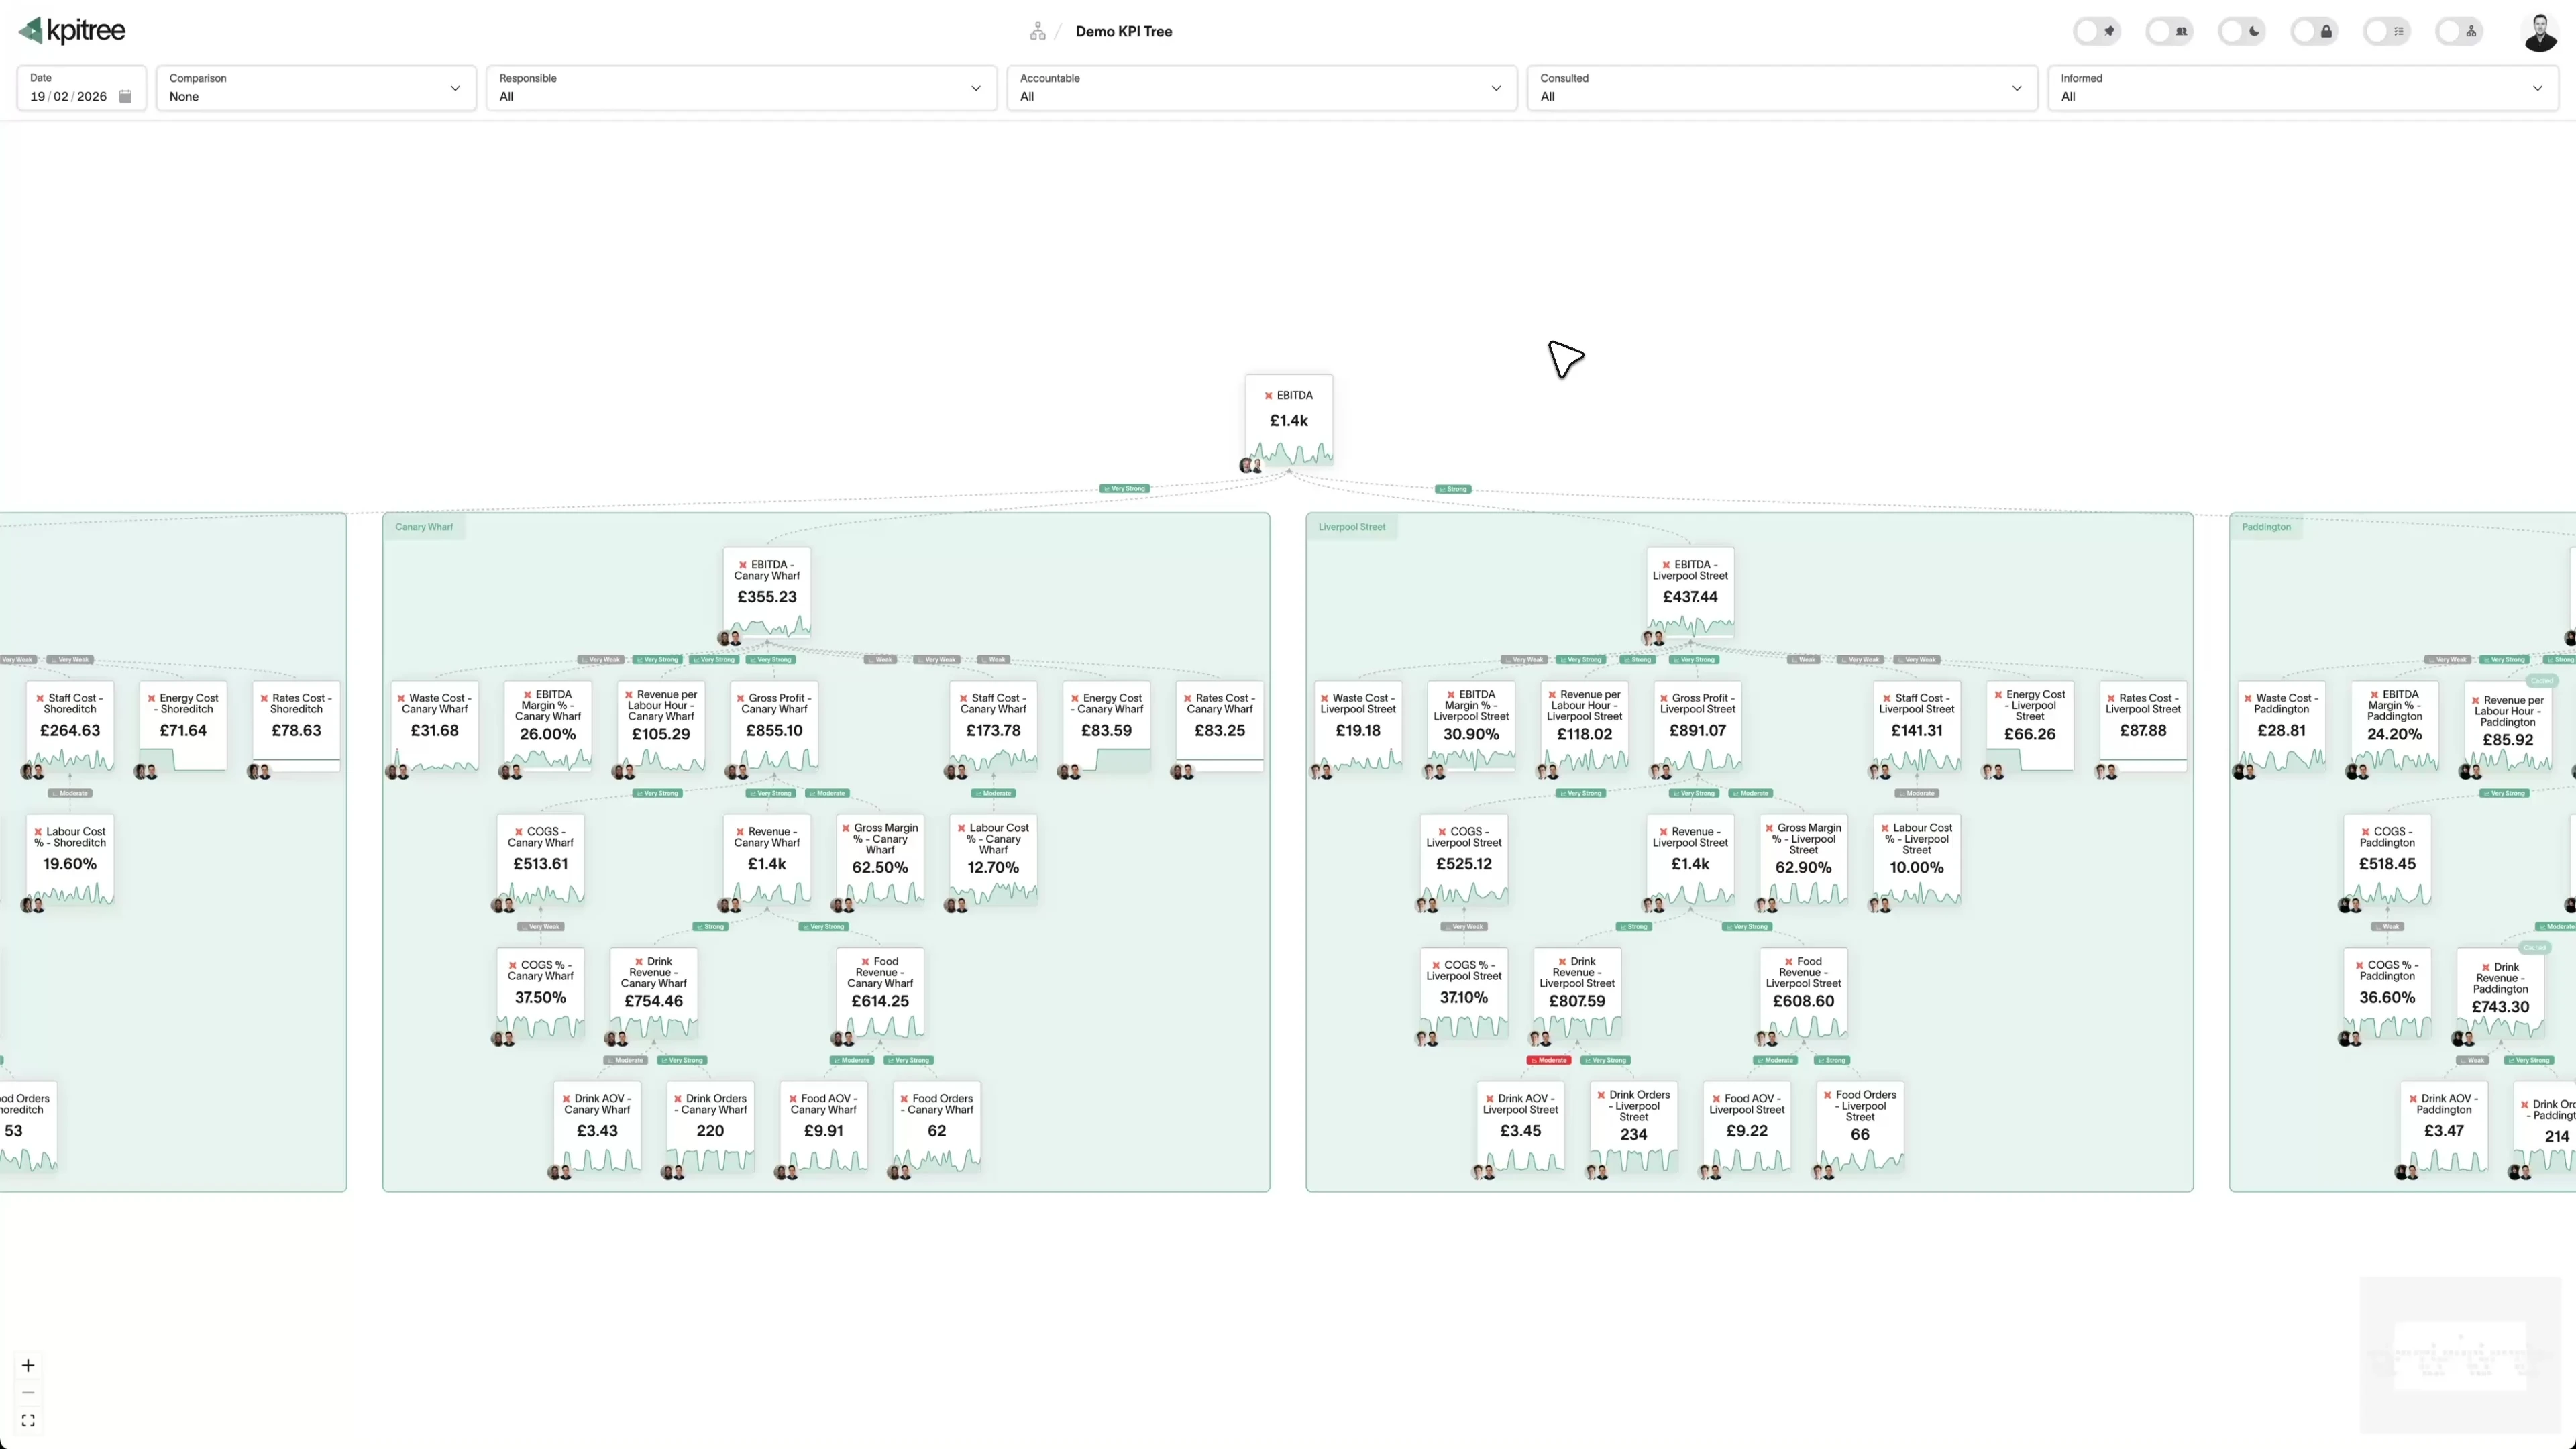
The whole business on one causal map
KPI Tree maps every metric in your organisation into a single interactive model, from board-level outcomes down to the operational drivers that move them. Every relationship on the map carries a confidence level and statistical significance, retested against your data daily and statistically proven over time, and your team prunes anything they know is not causal, so the map is evidence rather than opinion. Budgets, forecasts and targets flow through the same pipeline as your actuals, so plan versus reality sits on the same view. It is one model, read by your leadership team on Monday morning and by every AI agent your company uses for the rest of the week.
- Every metric connects on one map, from revenue and margin down to the team-level drivers beneath them.
- Every driver relationship carries a confidence level and statistical significance, retested against your data daily.
- AI drafts the tree from a plain-English description of your business, and your team corrects it on the canvas.
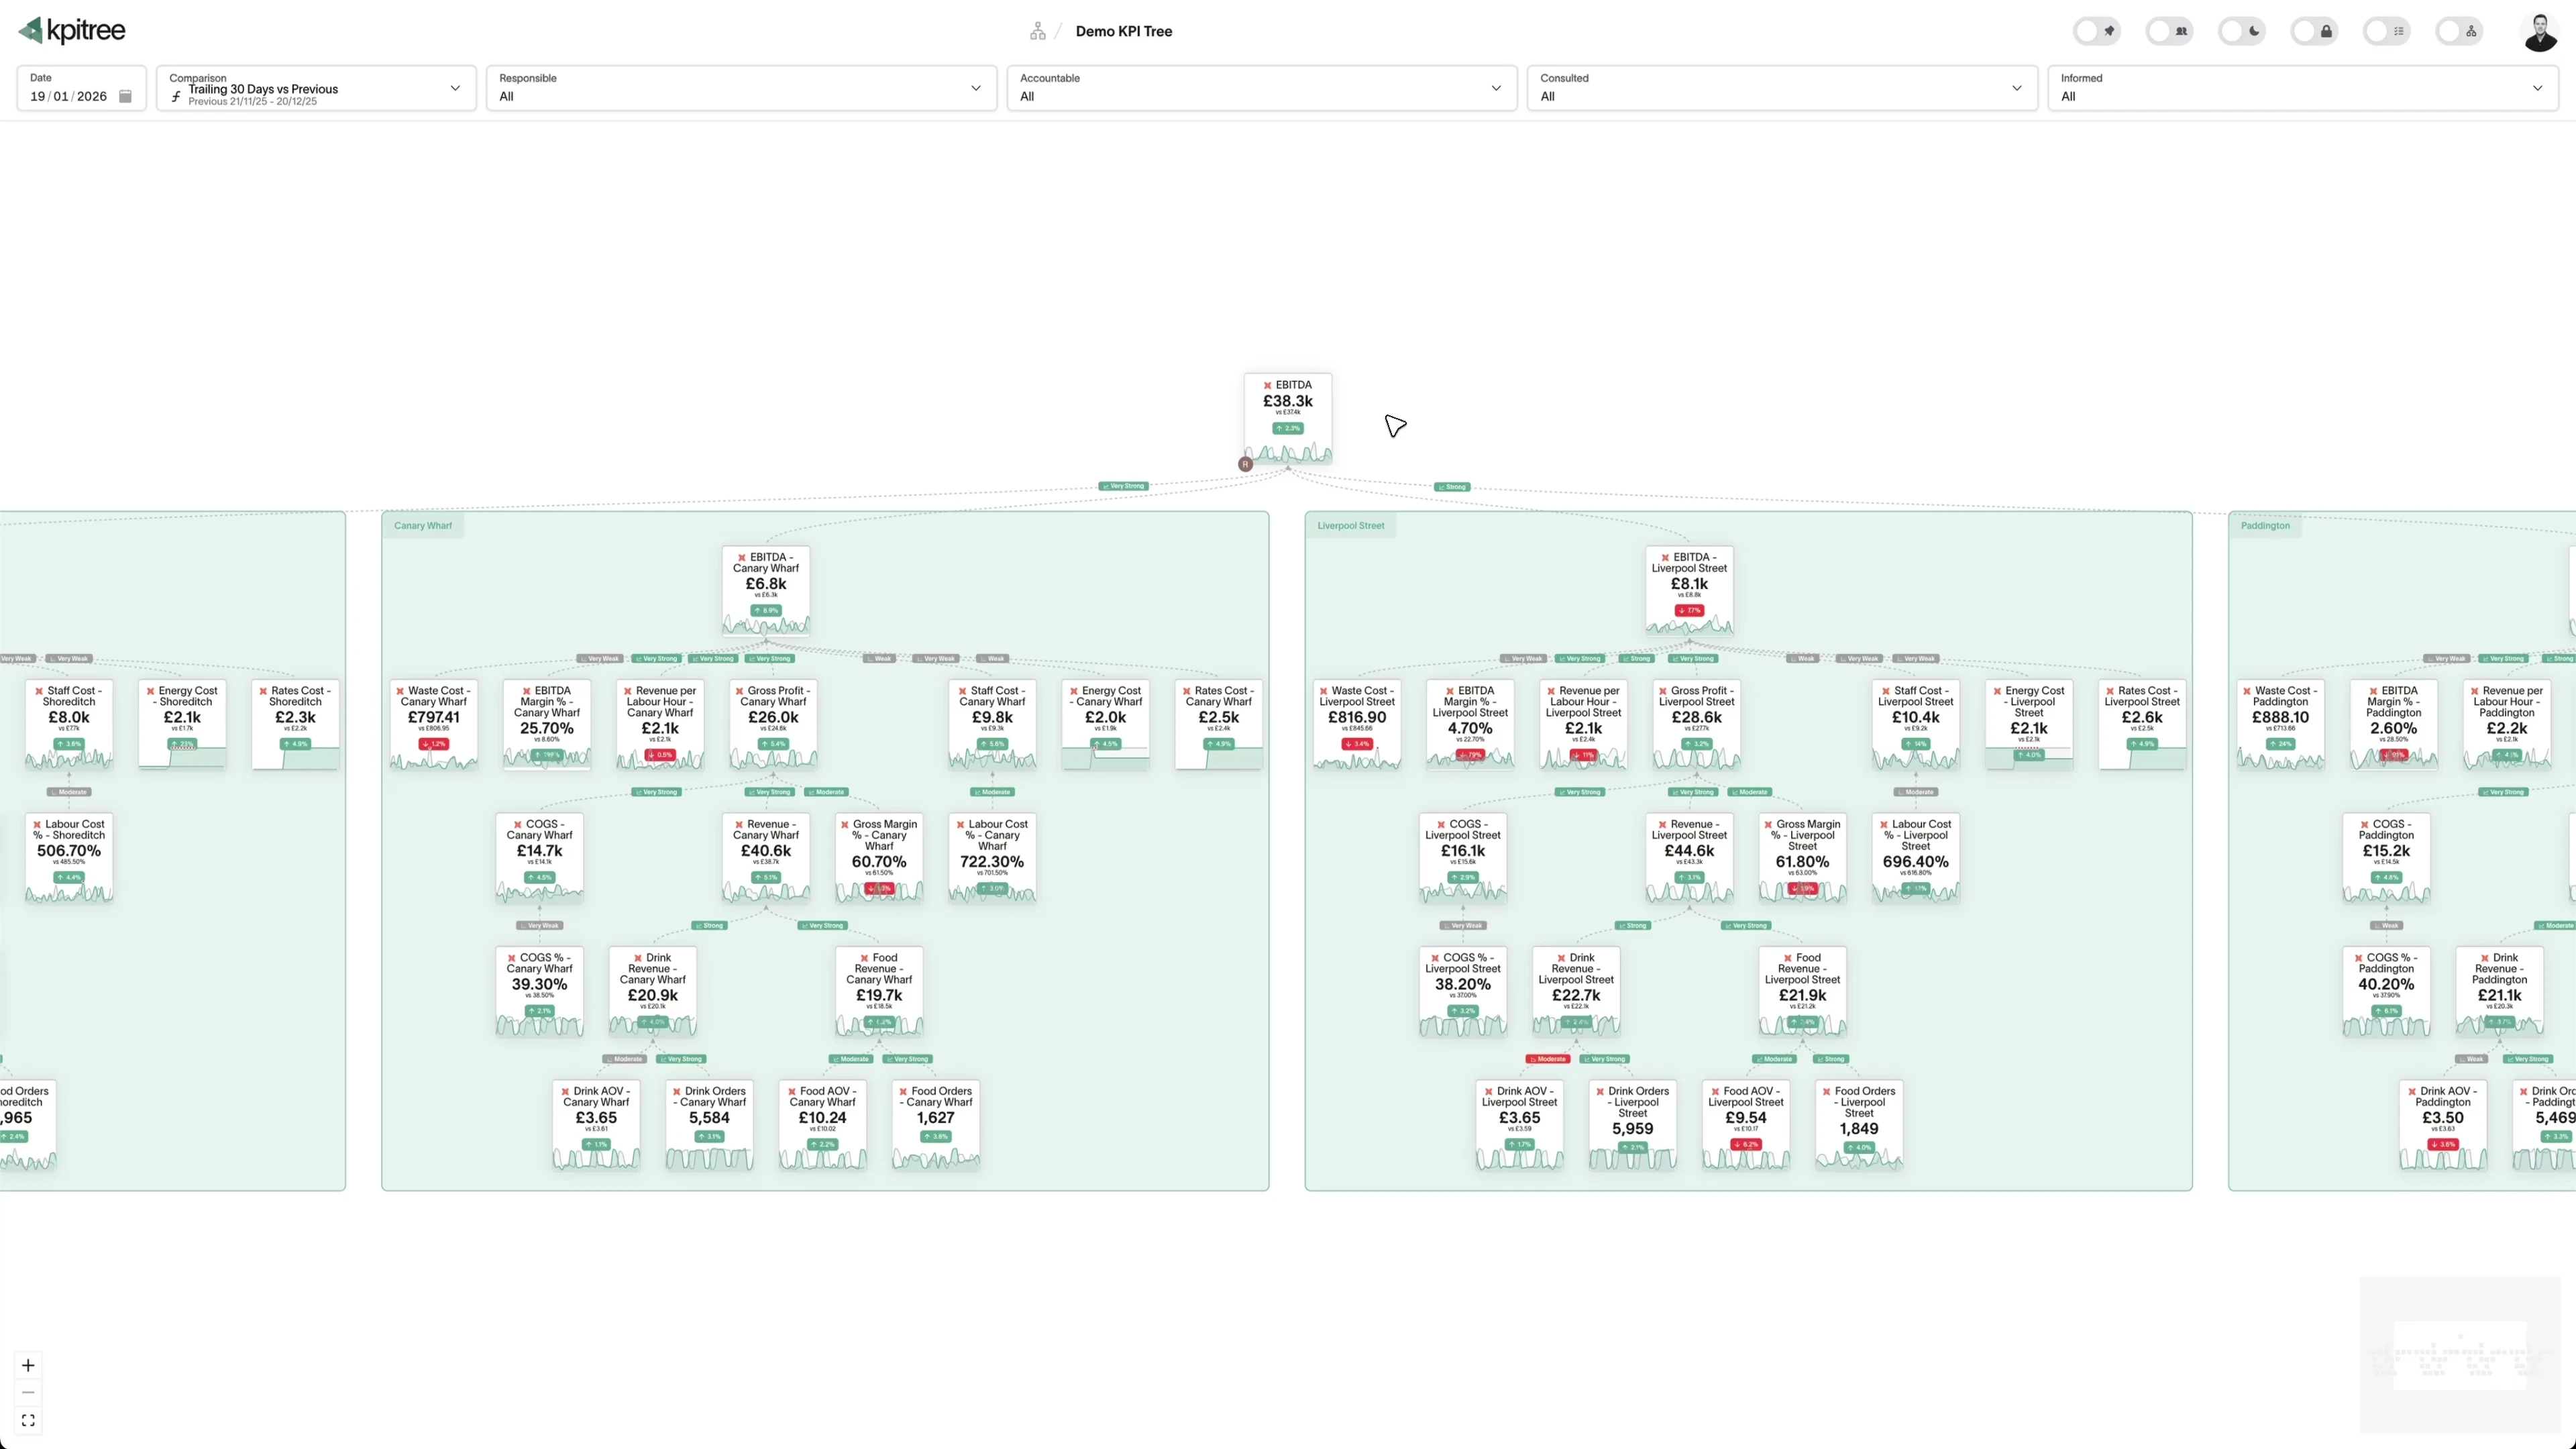
- Budgets, forecasts and targets flow through the same pipeline as actuals, so plan versus reality is one view, not two documents.

When a number moves, a name moves with it
Every metric carries full RACI ownership, kept current against your live org chart, so who acts is never a question. Pushes fire when the metric itself moves, on an outlier, a crossed threshold, a metric that goes silent or a missed target at period close, and route to the named Accountable owner via Slack, email, WhatsApp or SMS, with the driver behind the movement attached and scored for confidence and significance. The action created is tracked against the metric it is meant to move, escalation climbs the org chart automatically if nobody acts, and the verified-impact status later shows whether the number moved. The loop closes without you chasing it.
- Every metric names who is Responsible, Accountable, Consulted and Informed, kept current from your directory.
- Pushes fire when the metric itself moves and route to the named Accountable owner, with the driver and its confidence and statistical significance attached.
- If nobody acts, escalation climbs your live org chart automatically until someone does.
- Every action is tracked against its metric, and its verified-impact status shows whether the number moved.
Strategy on one map, read from the data
Objectives cascade into key results and the initiatives that deliver them, drawn on the same map as your metrics. Each key result is a real metric with a target, so progress is read from the data rather than typed into a status field, and each initiative carries a budget, spend, a named owner and milestones. Outcome and execution are tracked apart, so a fully delivered plan cannot hide a flat number. The Portfolio view then reads the evidence across every initiative, scoring how far its metrics have moved since the work began, so a review can tell a wrong bet from one that has not had time to land.
- Each key result is a real metric that completes when it hits target, so nobody self-reports progress.
- Initiatives carry budget, spend, a named owner and milestones, linked to the metrics they are meant to move.
- Outcome and execution are tracked separately, so a delivered project on a flat number is visible at a glance.
- The Portfolio view shows where the money is working, with every initiative scored by the movement of the metrics it targets.
The board review becomes a working session
Share the live model instead of a deck. Presence avatars and live cursors show who else is on the canvas, so the review happens on the model itself rather than on a screenshot of it. When someone asks what happened to gross margin, you trace the movement through the tree in seconds, with each driver's contribution quantified and its confidence and statistical significance on screen. The numbers are always current, so nothing goes stale between assembling the pack and opening the meeting, and the questions raised in the room become owned, tracked actions before it ends.
- Live presence and cursors let the whole leadership team work on the same canvas at the same time.
- Any movement is traced through the tree in seconds, with each driver's contribution quantified and its confidence and significance shown.
- The view is always current, so board packs stop going stale between assembly and meeting.
- Questions raised in the room become actions with named owners, tracked against the metrics they target.
“Dashboards show what happened. Chat tools answer questions. Neither names who acts, routes the moment to them, or proves the action moved the number. That loop is the product.”
The closed loop no dashboard, chat tool or goal tracker ships
Every analytics vendor promises insights to action, and every goal tracker promises alignment. KPI Tree ships the mechanism between them: causality tested statistically, ownership that routes, impact that is verified, and one model serving people and agents alike.
Causality you can defend to the board
Every relationship on the map carries a confidence level and statistical significance, retested daily and statistically proven over time, and your team prunes the correlations they know are not causal. When you say marketing spend drives pipeline, the confidence and significance behind the claim travel with it. That is evidence you can stand behind, not a generated narrative.
Verified impact is the learning signal
Actions and initiatives are verified against the metrics they were meant to move, by the same pipeline that calculates your actuals. Most tools learn from queries; this one learns from behaviour change, so the record of which levers actually move which numbers compounds quarter after quarter.
One model for your team and your agents
The same causal model your leadership team reviews is what every AI agent your company uses reads over MCP, through Canopy, KPI Tree's business context layer, with ownership and verified-impact status attached to every answer. You do not swap your tools for ours; you make the agents your teams already use accountable.
Common questions
How is this different from the dashboards I already have?
Why not just ask an AI assistant about our data?
Does this replace our OKR tool?
Can I run a board meeting from it?
How much of my team's time does this take to set up?
What does this do to our data and AI costs?
Related guides
Metric trees for executives
A visual guide for senior leaders
How to present metrics to your board
From data dump to decision-ready board deck.
How metric trees close the strategy-execution gap
The gap is not between strategy and execution. It is between strategy and understanding.
See the loop run on your own numbers
Book a walkthrough. We map your top metrics, show the drivers behind them with confidence and significance attached, and run the loop end to end, from a metric moving to a named owner acting to the impact being verified.