
Revenue teams track everything and explain nothing
You have a CRM, a BI tool, a forecasting platform, and a dozen dashboards. You can pull any number in seconds. You still cannot answer the three questions that decide the quarter: what is dragging the number down, who is fixing it, and did the last fix work?
Pipeline reviews that end where they started
Every Monday you stare at a dozen reports and debate whether the problem is lead volume, conversion, deal size, or cycle length. Each metric lives in a different tool with a different owner. By the time the room agrees on a diagnosis, the week is half over, and next Monday the same debate starts again from zero.
Nobody owns the number between the numbers
Reps own quota. Marketing owns MQLs. But the conversion rate between stages, the average deal size trend, the expansion revenue ratio? Those metrics fall through the cracks because nobody sees them as theirs. They sit in dashboards everyone can see and nobody watches, and when one of them quietly stops updating, nobody notices that either.
Every tool promises insights to action. None of them close the loop.
Your CRM flags a deal at risk. Your BI tool spots a conversion dip. Your forecasting platform projects a miss. Then what? No named person is notified, no action is created, and nobody ever checks whether the response moved the number. The insight dies in a dashboard nobody reopens.
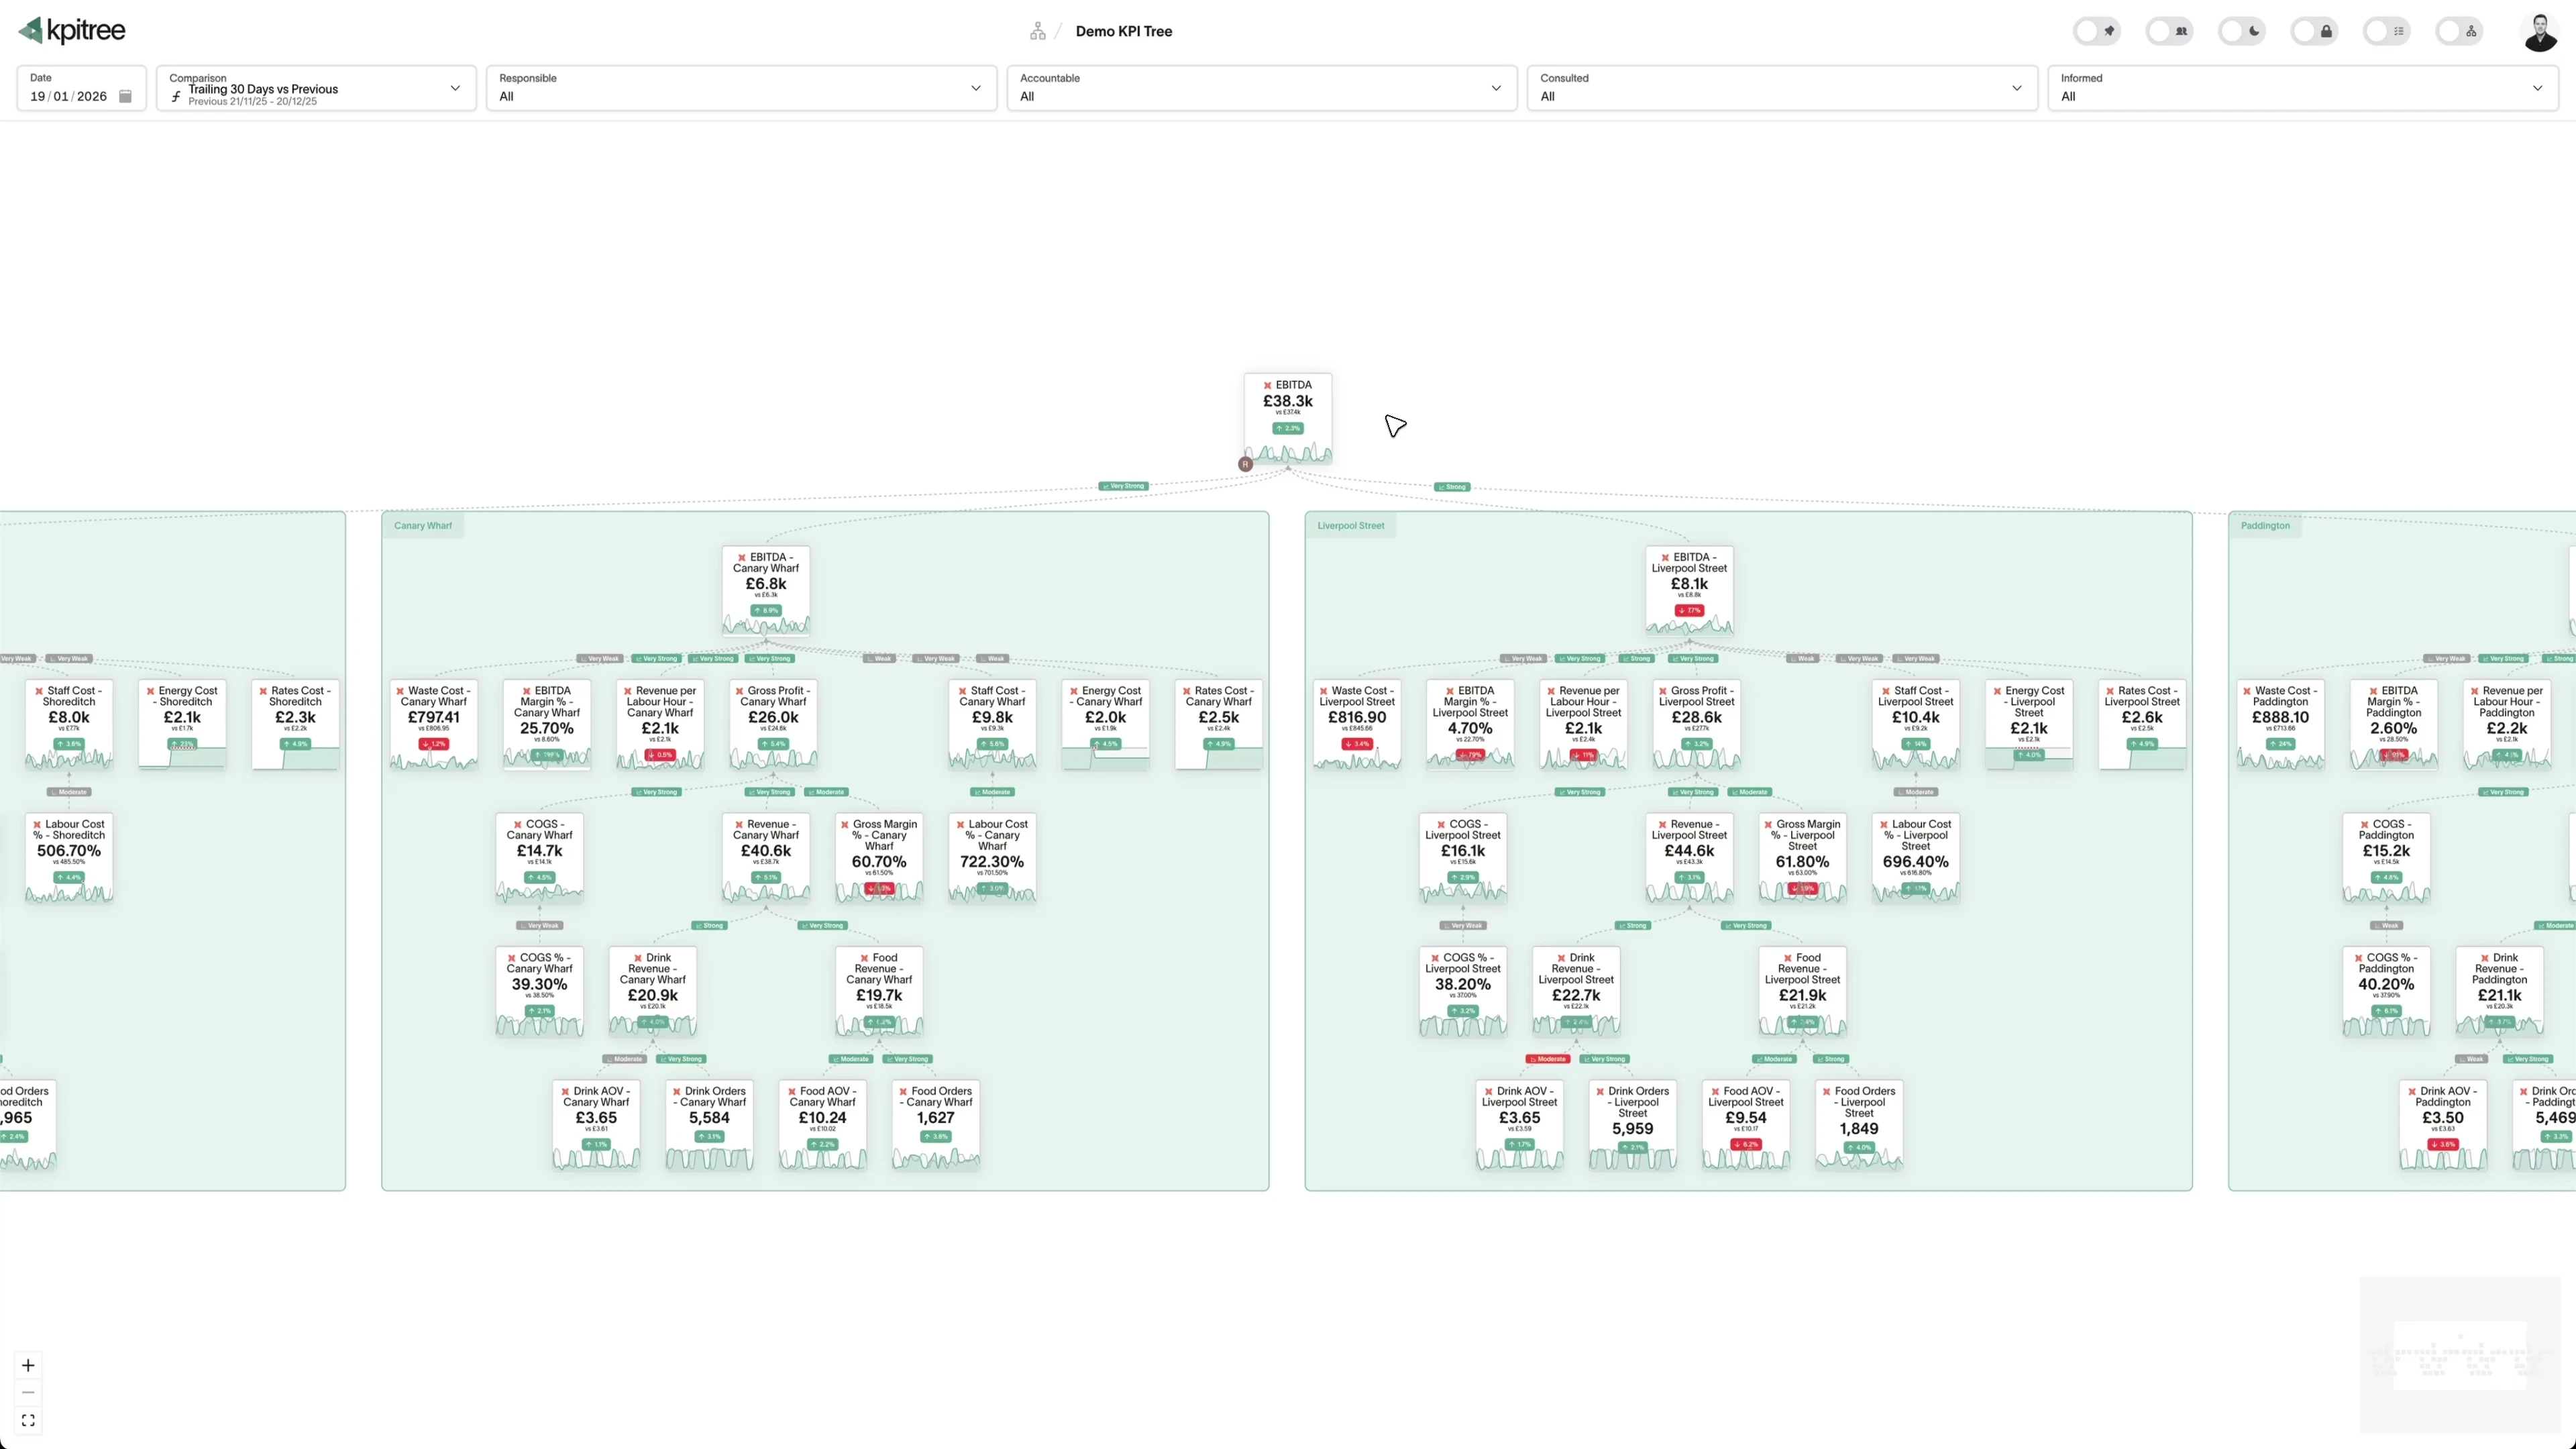
See the revenue engine as a driver tree
Start with the top-line number and break it down through the levels that produce it: pipeline generation, stage conversion, deal size, sales cycle, and the daily activities feeding them all. Describe your funnel in plain English and AI drafts the tree. Your team corrects it, and from then on every relationship in it is tested against your data daily, with confidence levels and statistical significance on every edge.
- Revenue decomposes into pipeline, win rate and average deal value, with expansion and renewal levels added to match how your business actually earns
- Every edge in the tree carries a direction, a confidence level and a significance score, retested daily as new periods land
- Metrics from tools that never reach the warehouse, like billing or sales engagement platforms with an MCP server, join the tree through MCP data sources with the same ownership and targets
- Your CRM and your BI reports stay put. The tree is the layer that connects what they record.

Find the real bottleneck, not the loudest symptom
When the number dips, the instinct is to demand more pipeline. Sometimes the real problem is win rate, or deal size, or cycle length. KPI Tree ranks the drivers behind any movement by impact, each with the confidence level and statistical significance from tests that run daily, so the room starts from evidence instead of a hunch.
- Drivers behind any change are ranked by impact, with the statistical confidence of each relationship shown alongside
- Waterfall change insights show exactly what each driver added to or removed from the number
- Trace a miss level by level down the tree to the input that actually moved, before the meeting starts
- Stop solving the wrong problem because someone senior had a hunch
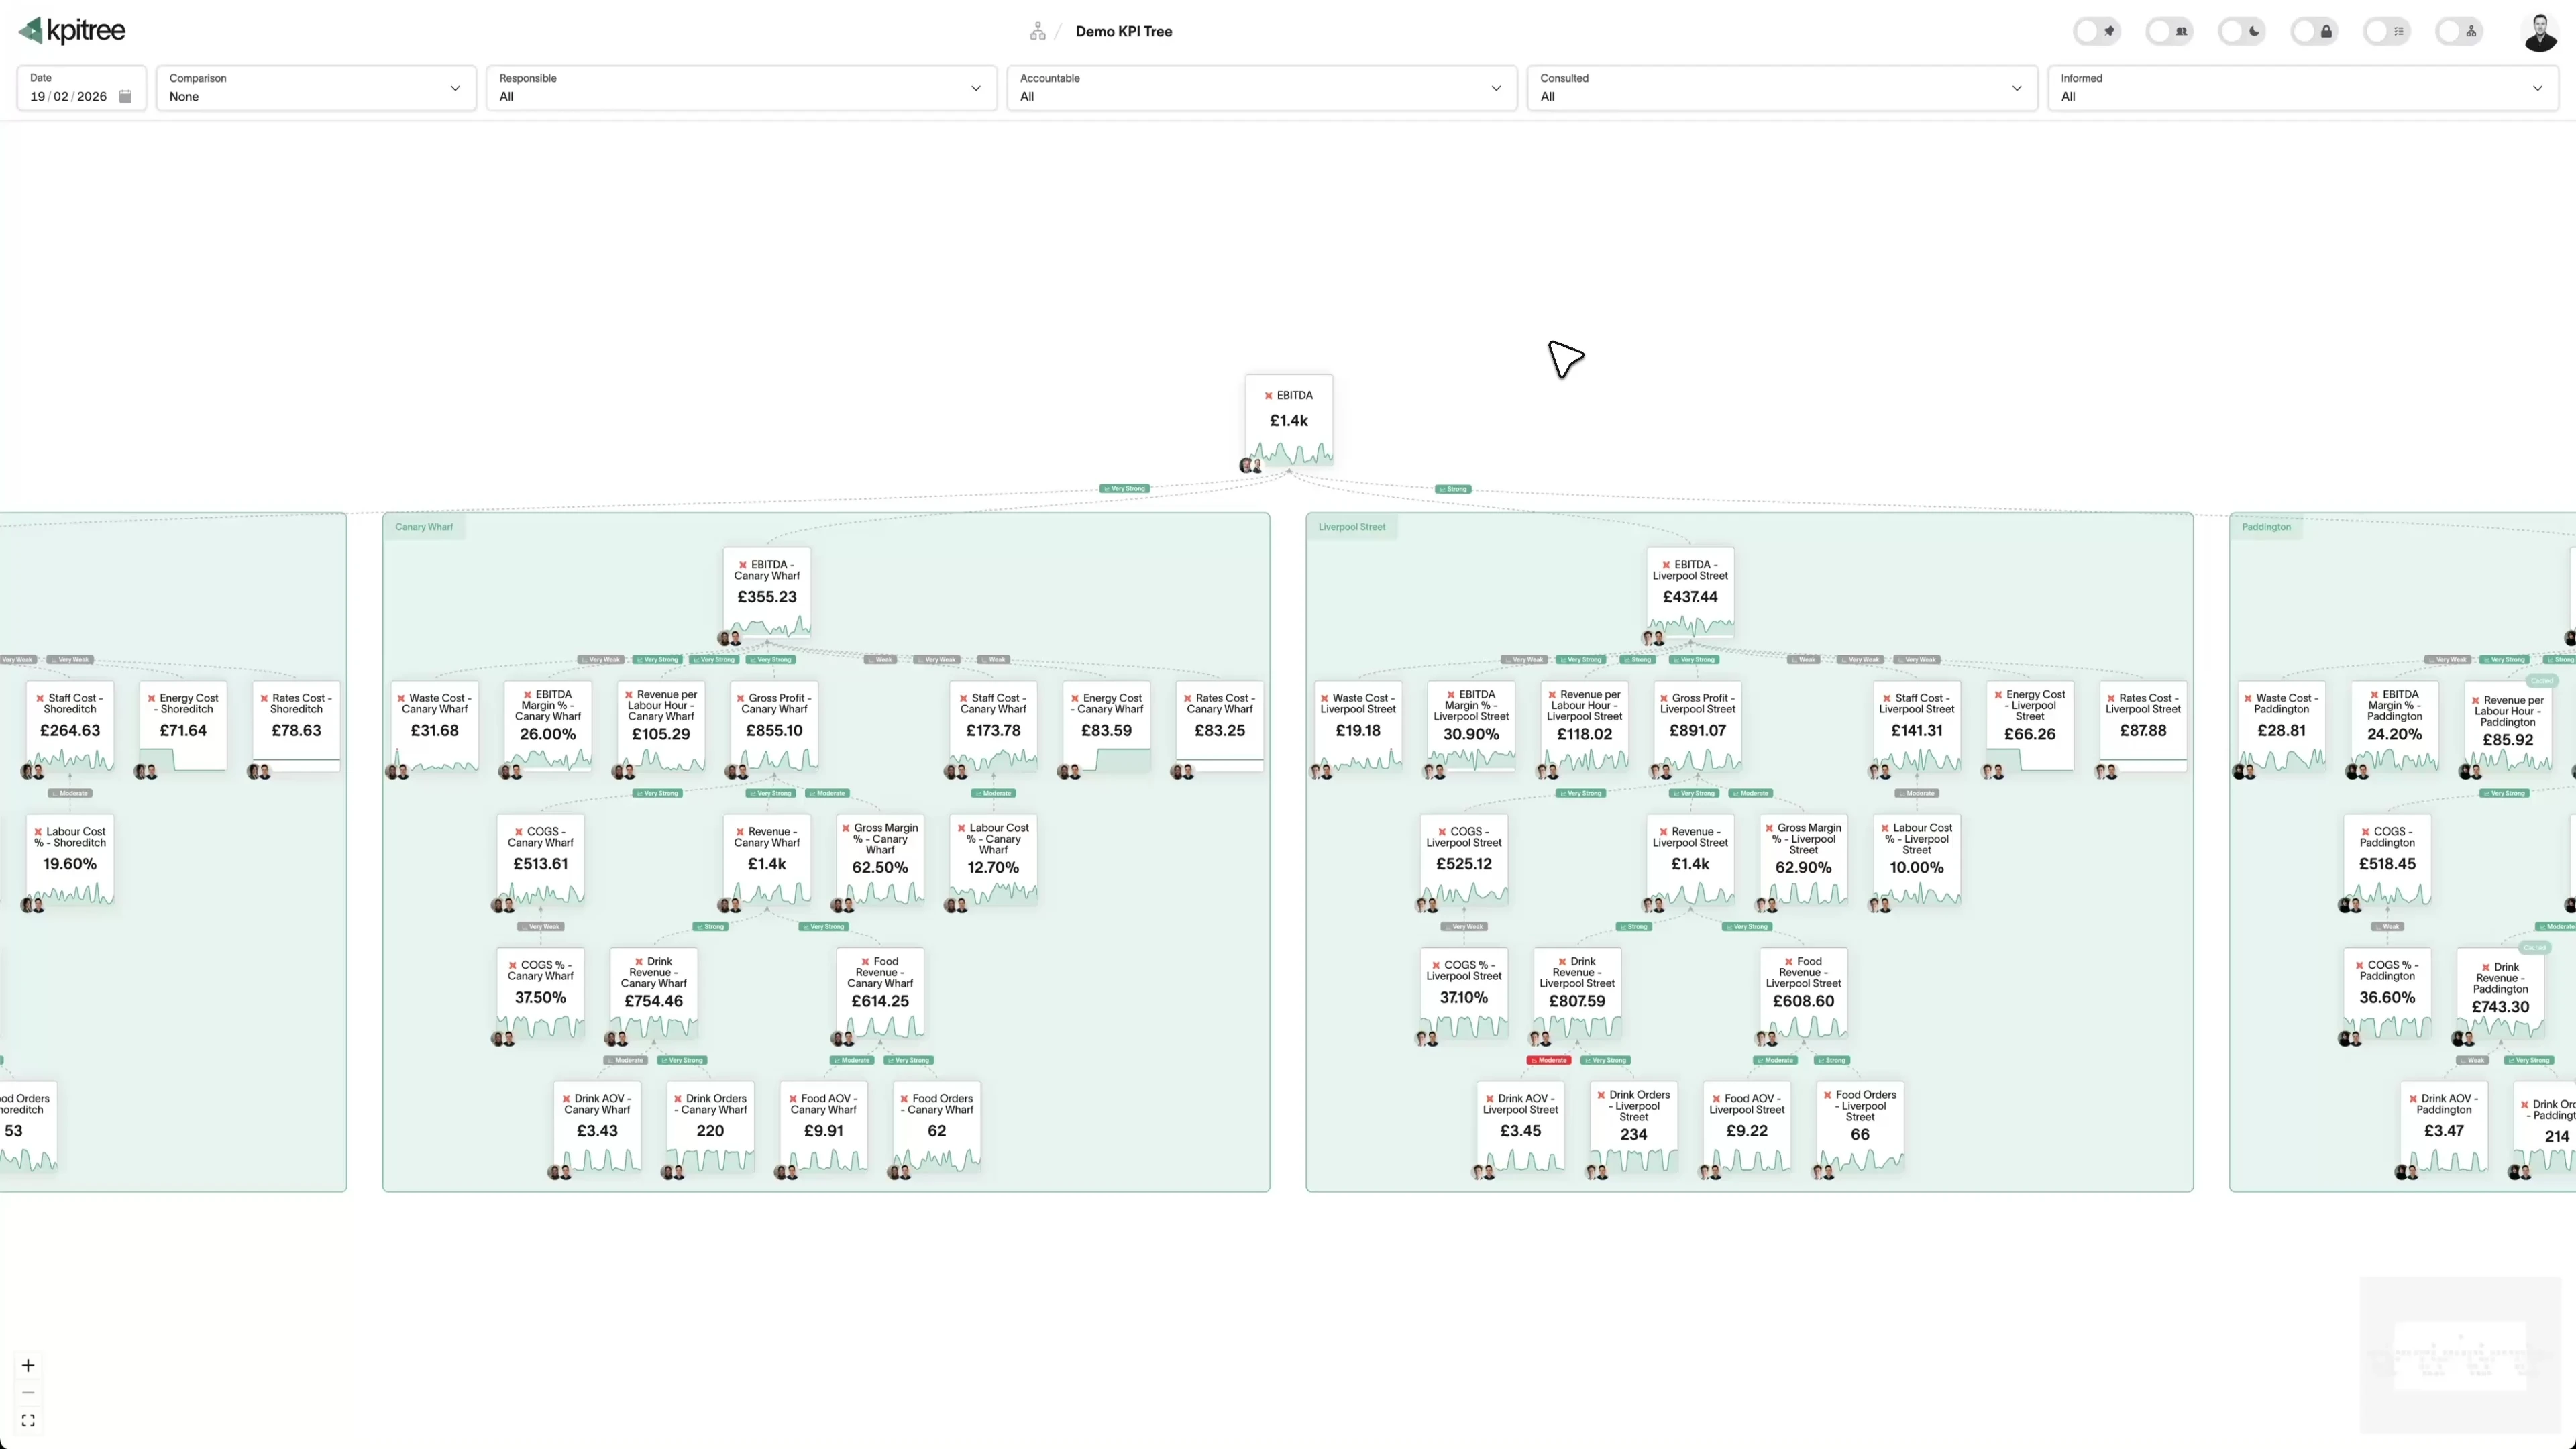
Every miss lands with a named owner, not a channel
KPI Tree holds RACI on every metric in the tree, kept current against your live org chart. When stage conversion crosses a threshold, when a metric goes silent, or when a period closes with the target missed, the push goes to the named Accountable owner with the driver behind the move attached, and it escalates up the reporting line until someone acts.
- A VP owns pipeline. A manager owns stage conversion. A rep owns activity volume. Each person sees exactly what moves when they do.
- Triggers fire on threshold crossings, outliers, silent metrics that stop updating, and period-close target misses with a tolerance you set
- Owners are notified in Slack, email, WhatsApp or SMS, and the push escalates to their manager automatically when nothing happens
- Every workflow run keeps its history, so you can see the exact path from trigger to action
Actions with verified impact, not anecdotes in the QBR
When an owner responds to a miss, the action is logged against the specific metric it was meant to move. The impact is then read from the metric itself, not from what the rep or the manager said in the pipeline review. Over time you learn which plays actually move win rate and which ones just felt productive, and that record compounds.
- Every action links to the metric it targets, so two weeks later the number says whether it worked
- Targets track themselves and complete when the metric hits them, so nobody types progress into a status field
- Verified outcomes sharpen future recommendations, because the model learns from the actions reps and managers actually took
Ask about the pipeline where the deal review already happens
Mention KPI Tree in the Slack channel where your team already runs the deal review and ask how pipeline is tracking, why stage two dipped, or who owns expansion revenue. Answers come back threaded, with charts in the channel and one-tap follow-ups, grounded in the same tree, the same significance-tested driver edges and the same ownership your team sees on the canvas. And the same context serves every AI agent your team uses, through Canopy, KPI Tree's business context layer.
- Answers are scoped to the permissions of whoever asks, so a rep in Slack sees exactly what they would see in KPI Tree
- Agents connected over MCP read the driver edges with their significance scores, the named owner, and whether the last action worked
- Answers draw on comparisons precomputed in KPI Tree's own compute engine, and a daily spend cap per workspace keeps AI cost predictable
“Your CRM records every call and your BI tool charts every stage. Neither can say what is dragging the number down with statistical confidence, who should act on it, or whether the action worked.”
Your CRM records activity. KPI Tree reveals the system.
Every sales tool claims to turn insights into action. None of them describe what happens between the two. We do: the metric moves, the named Accountable owner is notified with the driver attached, the action is tracked against the metric, and the impact is verified.
Structure, not just charts
A dashboard shows numbers side by side. A tree shows how they connect, with a confidence level and a significance score on every relationship, retested daily. That structure is what lets you trace a shortfall to its cause instead of guessing which lever to pull.
Ownership that changes behaviour
Every metric has a person next to it, not a team or a department. When the metric moves, that named owner is notified, and when nothing happens the push climbs the live org chart to their manager. Accountability holds at quarter end without anyone chasing it.
Evidence, not opinion
Driver relationships hold their place because daily tests keep proving them, not because someone asserted them in the meeting. Effort goes where the confidence and significance scores point, not where the loudest voice insists. The Monday debate gets shorter.
Common questions
How is this different from the dashboards in our CRM?
What data sources does KPI Tree connect to?
How long does it take to build a revenue tree?
Does ownership actually change anything, or is it just a label?
Can reps and managers use it without leaving Slack?
What happens when the quarter closes and a target was missed?
Related guides
Metric trees for sales teams
Connect every rep activity to a revenue outcome
Leading vs lagging indicators explained
How leading vs lagging indicators connect in a metric tree
Conversion rate: a metric tree decomposition
Break conversion rate into its component parts so you can see exactly where prospects drop off and how to fix it
See the structure your pipeline reviews have been missing
Book a 30-minute demo. We will build a revenue tree from your real metrics and run the loop once: a metric moves, the named owner is notified with the driver attached, and the action is tracked until the number answers. No slides, no generic dashboards. Just your revenue engine, structured.