KPI Tree

For humans · Map + Measure

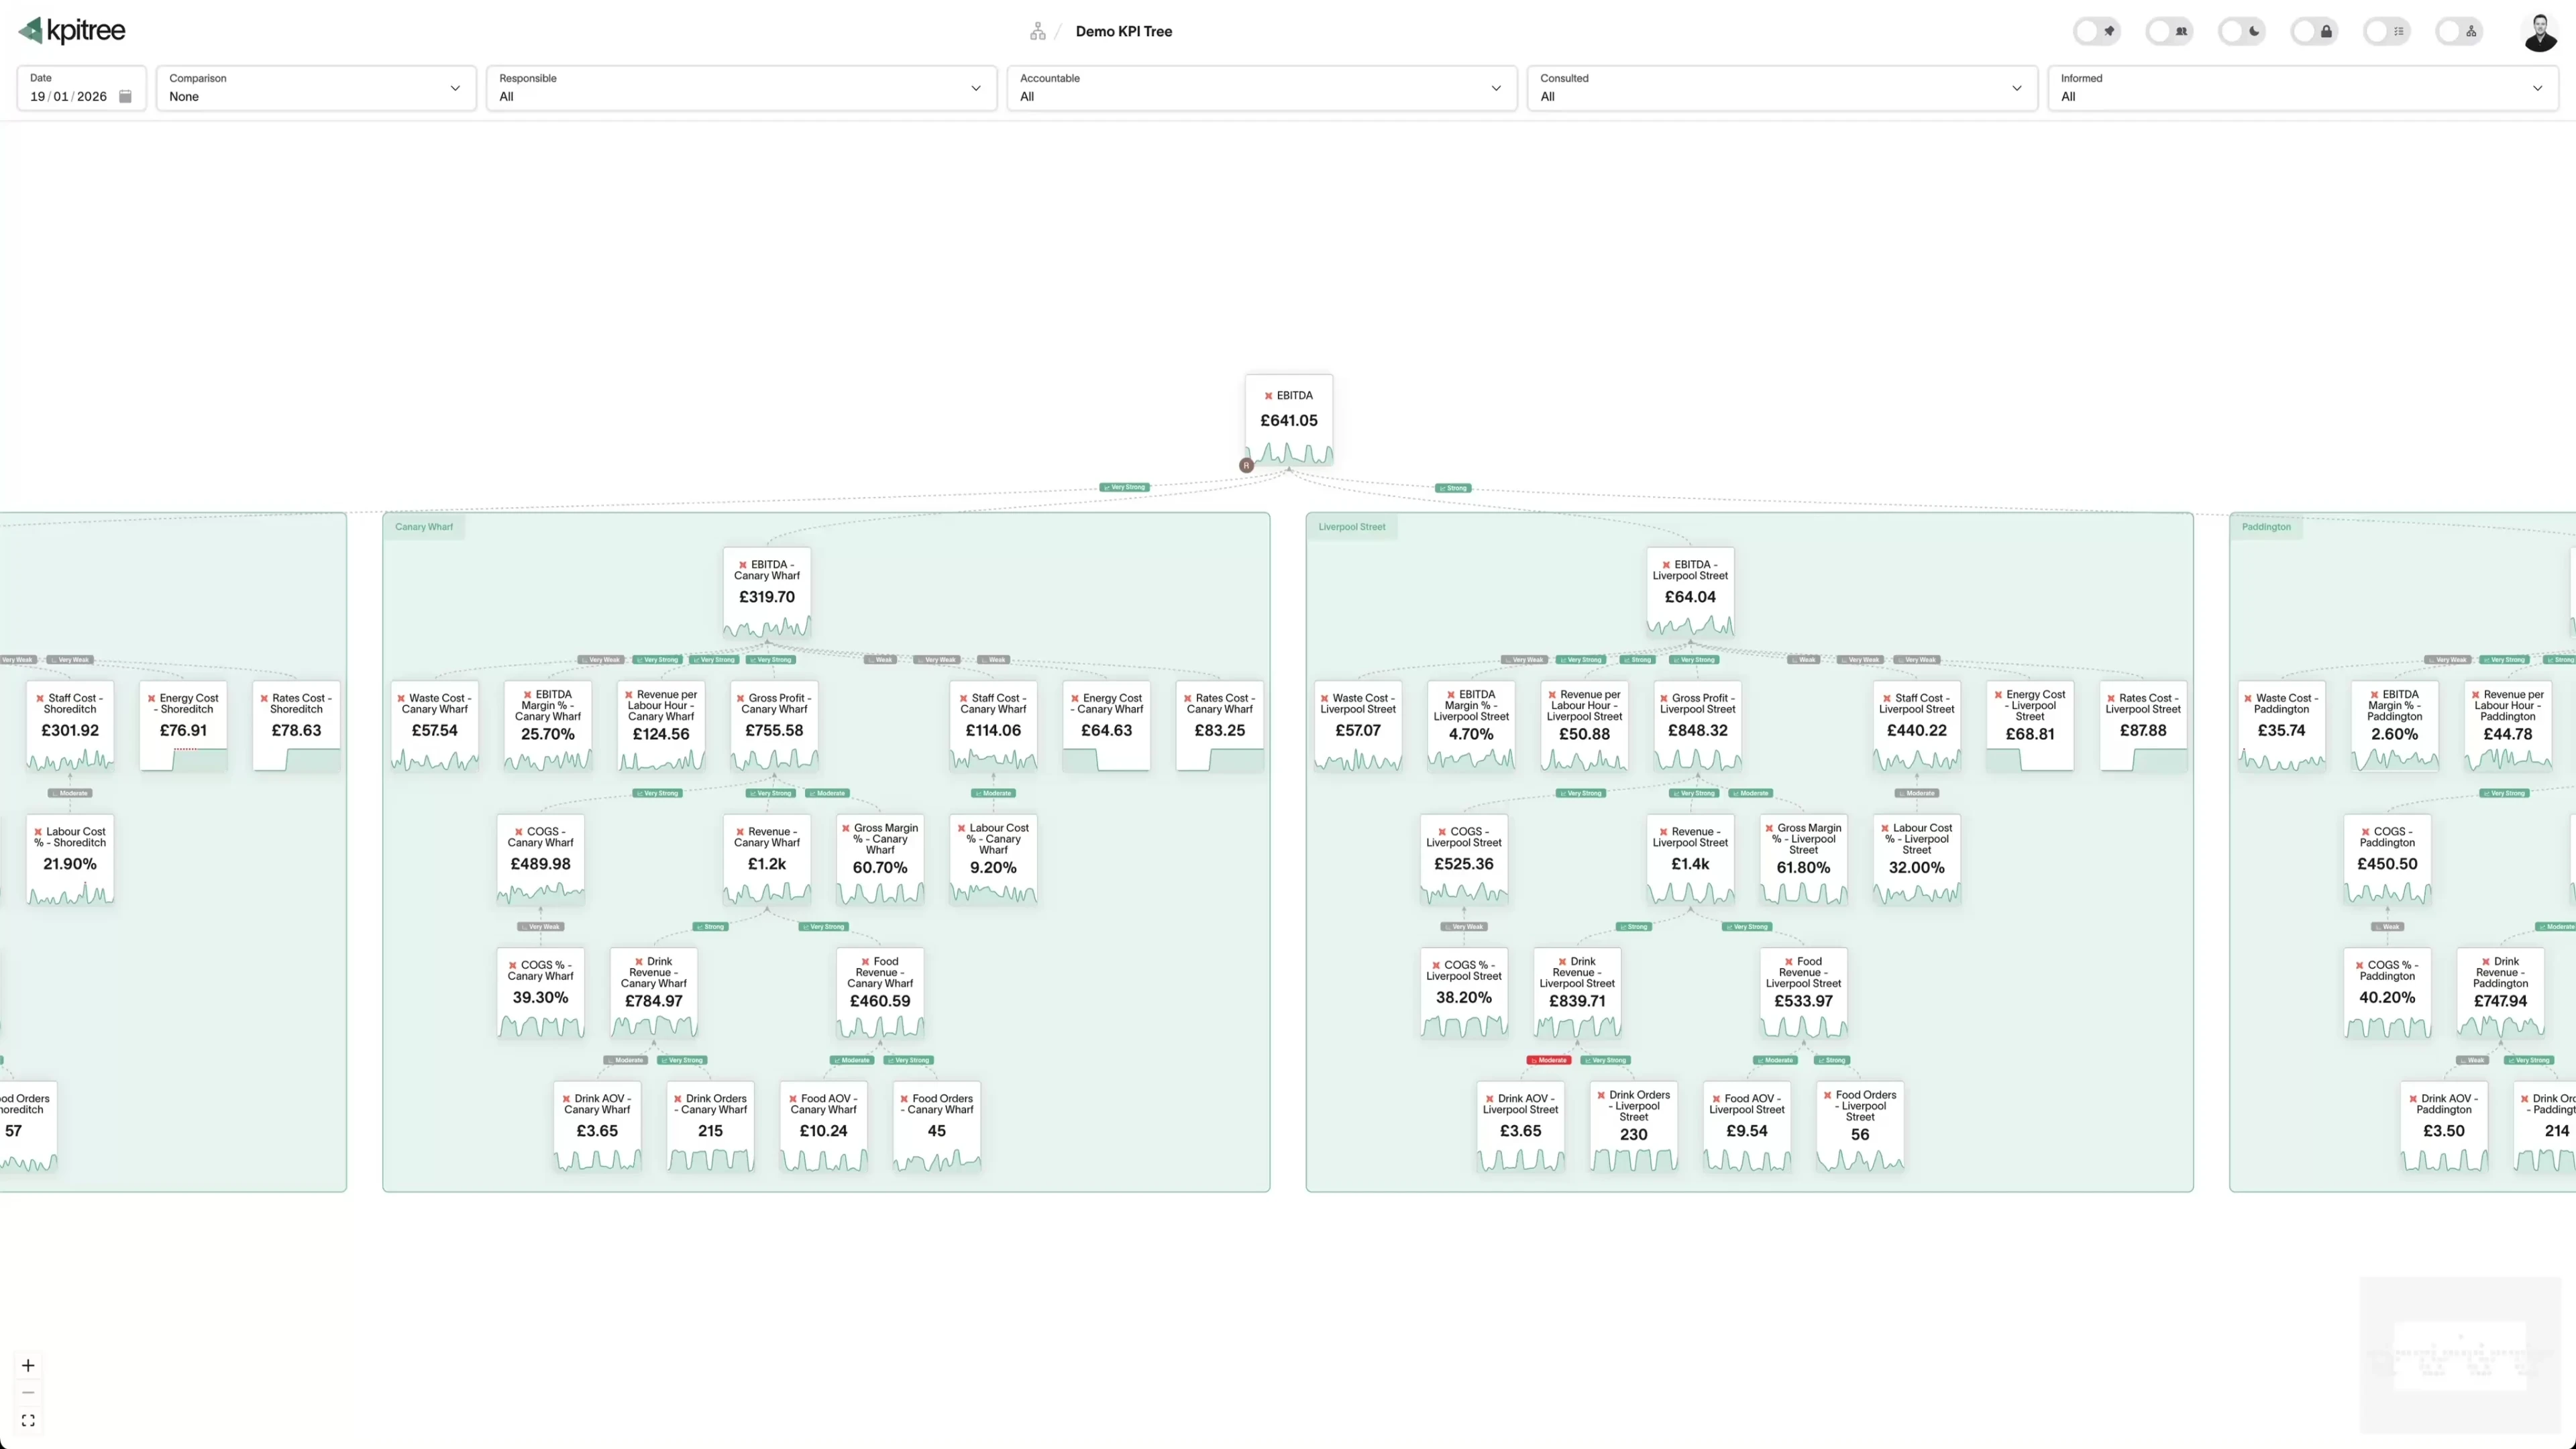
See cause and effect across your entire business.

A living causal model with confidence and statistical significance on every relationship, tested against your data daily. Your BI tool stays; this is the causal, owned layer on top.
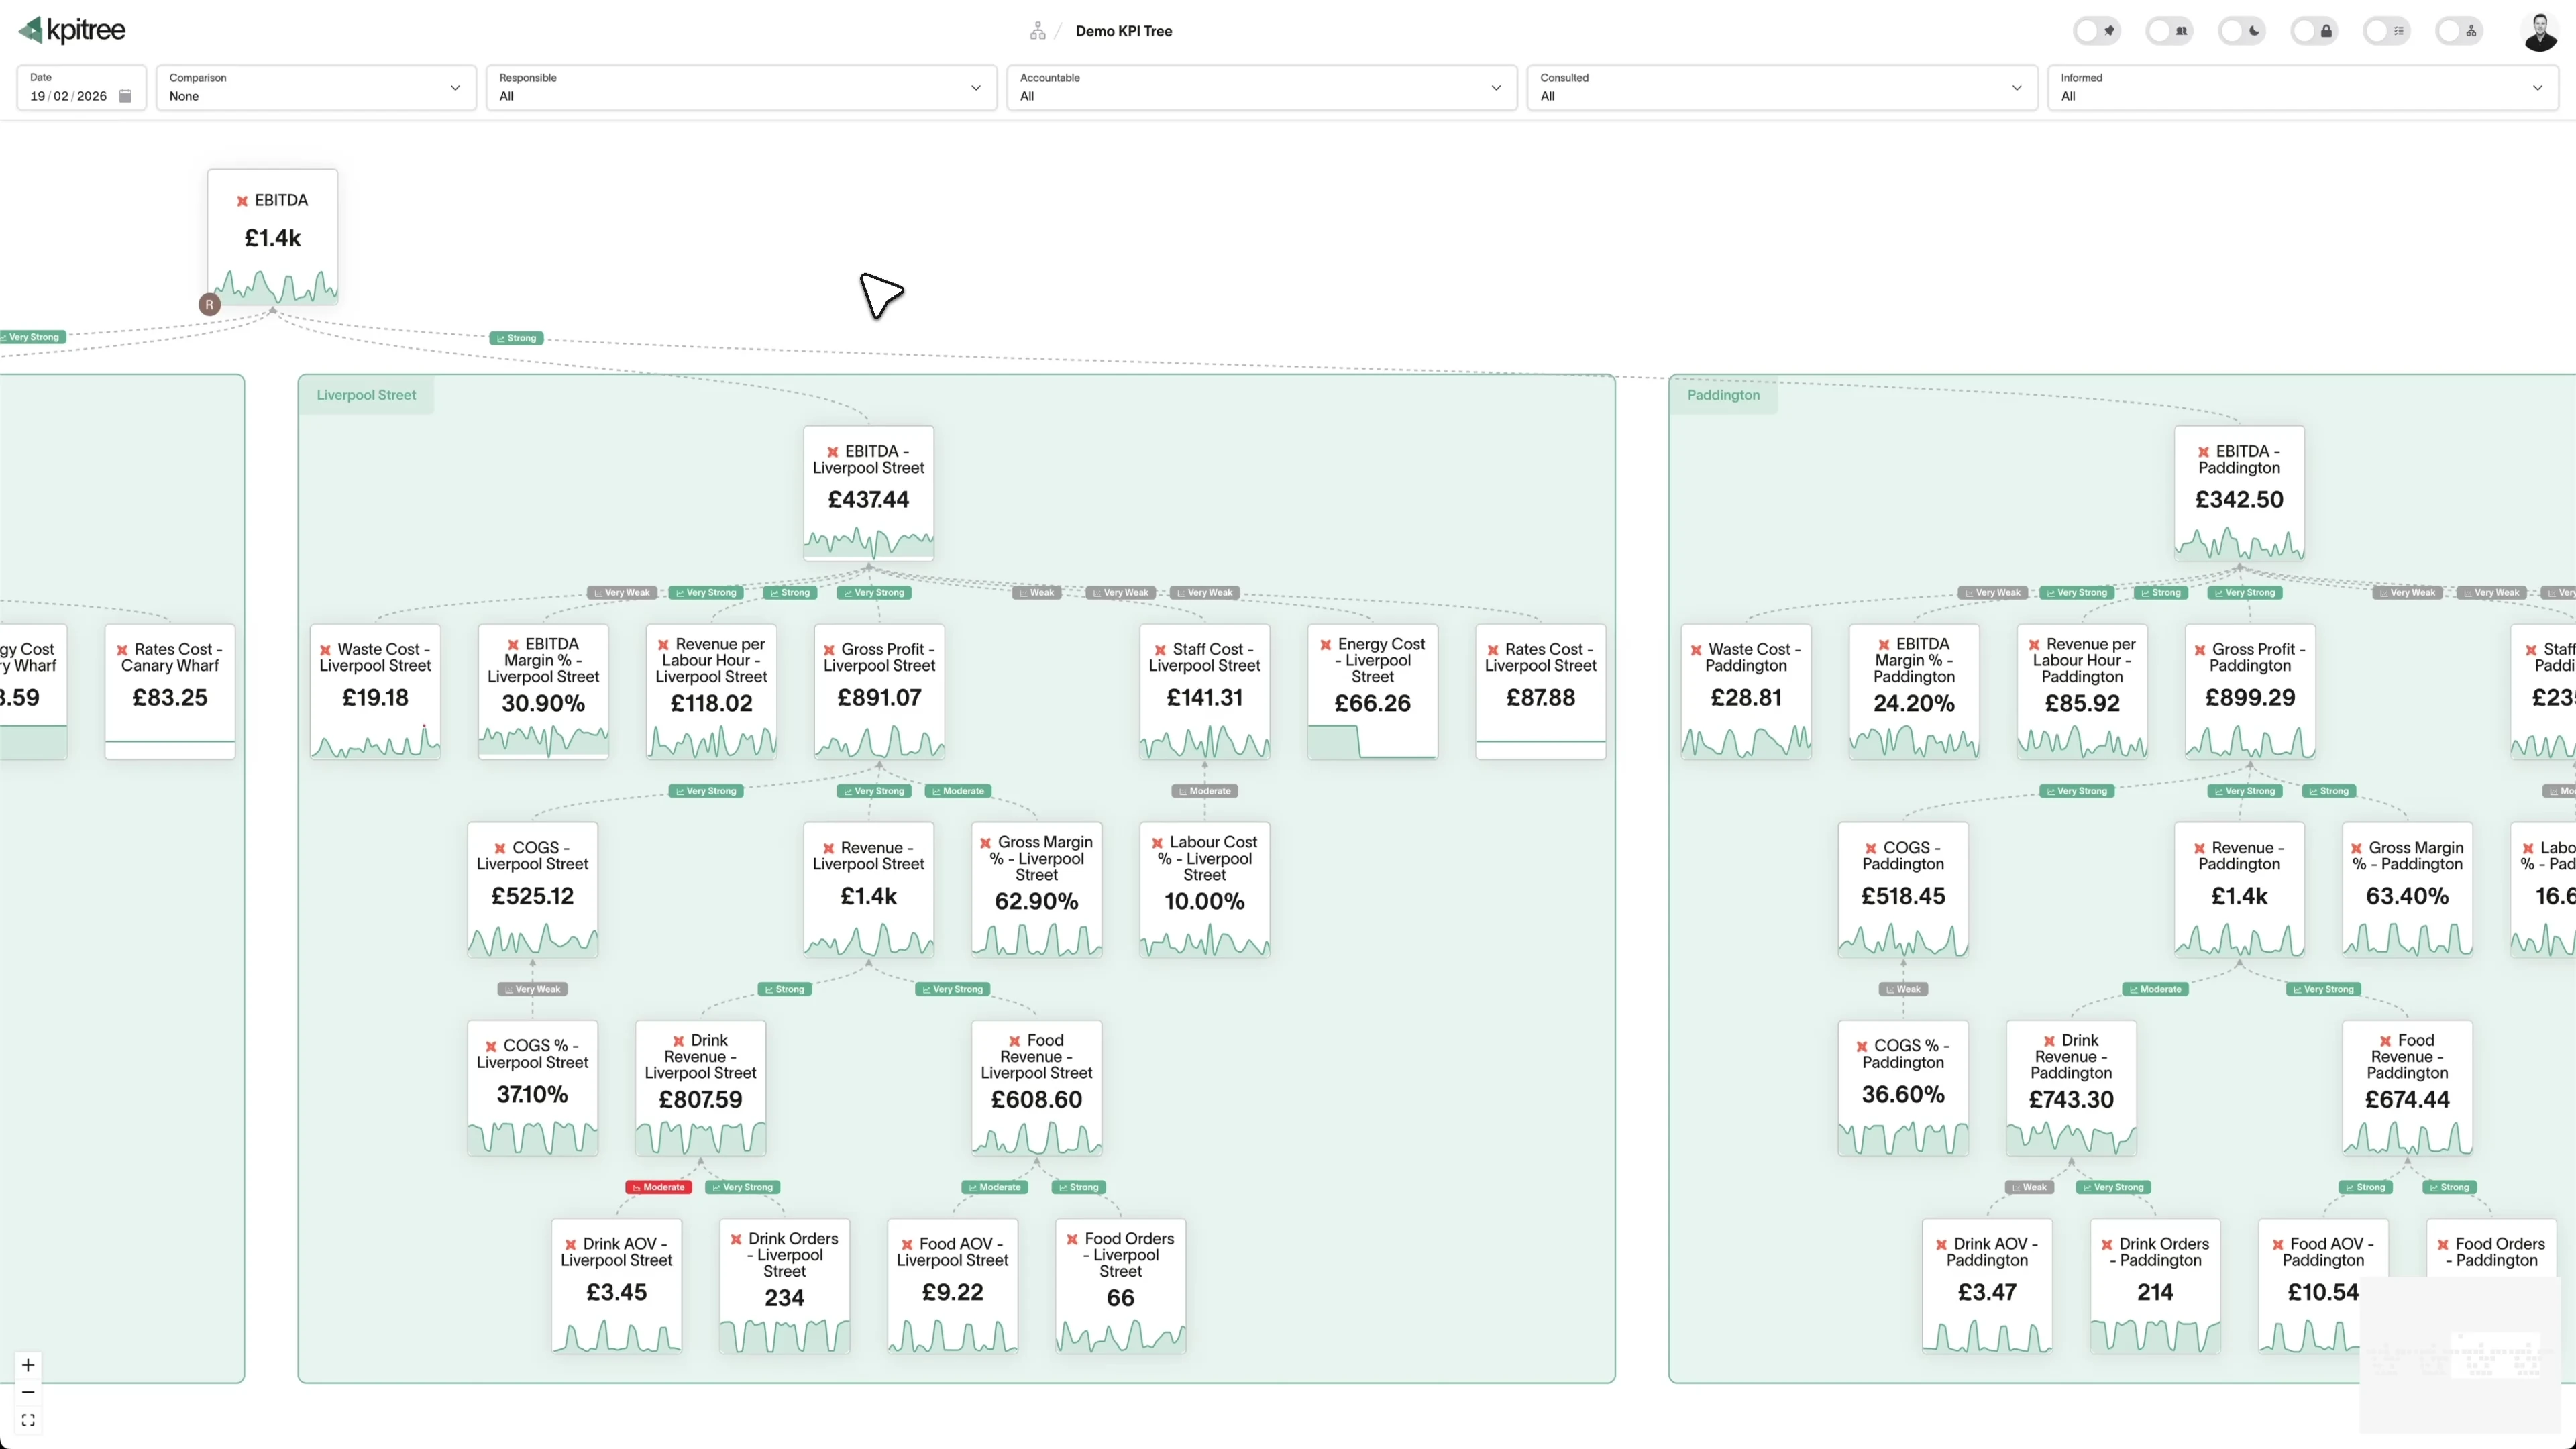
The whole business on one causal canvas. Built in minutes, tested daily.

AI drafts it. You correct it. Minutes, not workshops

Describe your business in plain English and AI drafts the tree. Every node and edge is editable, and from day one your data judges every relationship.

Causality, statistically proven. ML models, daily

Proprietary ML models and statistical tests run daily on every relationship, from Pearson correlation to Granger causality, Benjamini-Hochberg corrected. Correlation is never narrated as causation.

Any grain, any date. No modelling. Comparisons precomputed

Additivity-aware re-aggregation to any granularity, with more than twenty comparison frames precomputed for every date in your history.

Dashboards describe the business. Nothing connects it.

Every team has dashboards, and AI can now answer questions about any of them. Yet the connections between the numbers still live in nobody's head: marketing's metrics stop at marketing's wall, finance's at finance's, and when the north star dips, the argument about why happens in a meeting rather than in the data. The metric tree makes the relationships between metrics explicit, visible and measured, so the whole system sits on one canvas. And it starts alongside your BI tool, not instead of it: your dashboards stay, KPI Tree adds the causal, owned layer on top. Over time, most teams end up retiring their legacy BI tool once KPI Tree is the system of record for how decisions get made.

Marketing
Marketing Metrics
OverviewChannelsCampaigns
80,485
New Users
$46.24
Avg Order
13.3%
Repeat Rate
Total Sales, YoY
Top Channels
Organic
Paid Search
Social
Email
Referral
Operations
Operations Dashboard
OverviewSupply ChainFulfilment
98.2%
Uptime
1.2d
Avg Delivery
4,892
Orders/Day
Total Sales, YoY
Fulfilment Centres
London
New York
Berlin
Tokyo
Sydney
Sales
Sales Performance
OverviewPipelineReps
$2.4M
Revenue
342
Deals Won
68%
Win Rate
Total Sales, YoY
Top Products
Enterprise
Pro Plan
Starter
Add-ons
Services

Why keep a tree when you can ask AI anything?

Because asking gives you an answer, and answers evaporate. An agent on your warehouse re-derives the structure of your business on every question, at token and warehouse cost, and will happily narrate a plausible driver story it cannot test. Ask twice, get two stories. The tree inverts that: it is derived once, statistically tested every day, and corrected by the people who know the business, so every future answer, from a person or an agent, inherits that judgement. AI drafts, humans correct, evidence decides. LLMs made analysis cheap; that made validated causal structure the scarce asset, and the tree is where you accumulate it.

causal · q < 0.05lag 3dq < 0.01Revenue-15%Conversion-23%Traffic+2%AOV-4%Checkout-31%PricingPaidOrganicBasket sizeDiscountsPayment errorsPage speed

Describe your business. Get the tree.

Building a driver tree used to mean days of workshops, which is why most companies never had one. Now you describe your business in plain English and AI drafts the nodes, edges and relationships, from lead indicators to your north star. The draft is the start, not the answer: every node and edge is editable, and from the moment the tree exists, your actual data takes over as the judge of every relationship in it.

Metric tree visualisation loading

Every relationship, statistically tested every day

Correlation alone is not causation, so no edge earns its place on one number. An intelligence layer runs proprietary ML models and statistical tests daily across all your metrics: Pearson correlation to find the association, lagged cross-correlation to catch effects that arrive days later, partial correlation to strip out confounders, Granger causality to test whether the driver actually predicts the outcome, and BH-FDR correction so testing thousands of edges does not manufacture false positives. Every edge carries the result: direction, strength, lag and how sure the model is. Statistical driver signals with the working attached, not unfounded causal claims.

Pearson correlationr = 0.93
Lagged cross-correlationlag = 3 days
Partial correlation|r|z = 0.62
Granger causalityF = 8.4
BH-FDR correctionq < 0.05

Every driver edge. Every day.

A whole class of silently wrong numbers never happens

The most expensive data error is the one nobody notices: a headcount summed instead of taken at period end, a balance averaged instead of carried. KPI Tree reads aggregation semantics straight from your dbt model definitions, sum, average, last value and first value, and auto-discovers measures from semantic views. Dimension metrics label themselves, currencies and percentages are detected, and every metric gets a sparkline. Setup takes minutes, and the silently wrong number never gets the chance to exist.

Semantic layer sync loading

Comparisons without modelling

Switch any metric between daily, weekly, monthly, quarterly and yearly views instantly, re-aggregated automatically while respecting each metric's additivity: sums sum, rates average, balances carry their last value. More than twenty comparison frames are precomputed for every date in your history, from rolling 30 days and month on month to retail 4-5-4 weeks and Black Friday alignment, so comparing from any date needs no modelling and no waiting. The same precompute is what later turns roughly ten agent queries per metric into one. And the grid view gives your CFO the spreadsheet they already know, with the comparison visible at every date.

Time travel timeline loading

Trust what you see

A causal model is only as good as the numbers feeding it, so every metric is continuously checked for outliers, gaps and staleness. When a metric goes quiet, it does not sit behind a warning badge hoping someone notices: a silent-metric trigger routes it straight to the named owner. Stale data cannot hide, which is the precondition for anyone, human or agent, acting on a number with confidence.

Data quality checks loading

Plan against reality

Budgets, forecasts, targets and ramp profiles flow through the identical pipeline as your actuals, aggregated the same way at every granularity, so plan and reality can never disagree about how they were calculated. Ramp profiles model realistic adoption curves instead of flat assumptions. FP&A planning and operational metrics finally live in one causal model, which means what-was-the-plan is a question the tree can answer.

Review together, live

The tree is where the Monday metric review actually happens, not a screenshot of it. Presence avatars and live cursors show who else is on the canvas, edits appear for everyone without a refresh, and notifications arrive instantly. The review becomes a shared working session on the model itself, and the edits it produces make the model smarter.

Revenue · Liverpool St

15%

£43,452

vs £51,100 last period
Sarah
David

Common questions

What if the AI builds the wrong tree?
You edit it, and then the evidence takes over. Every node and edge is editable, and every relationship is statistically tested against your actual data daily, so the model is corrected by evidence, not locked in by a prompt. AI drafts, humans correct, evidence decides.
Is this causal or correlational?
Correlation is only the first gate. Every edge is run daily through the proprietary ML models and statistical tests described above, with BH-FDR correction controlling false discoveries across thousands of tests. Human edits then prune relationships the statistics cannot rule out. We tell you how sure the model is rather than overclaiming.
How many metrics can a tree hold?
Up to 5,000 metrics per account, from lead indicators to your north star, with viewport-prioritised loading so large trees stay instant.
Which warehouses does it work with?
Snowflake, BigQuery, Databricks, Redshift, Azure SQL and PostgreSQL, side by side on a single tree, with Google Sheets alongside for the numbers that live outside the warehouse. Metrics are calculated where the data lives, so the numbers always match it.
Does it replace our BI tool?
Not at first. KPI Tree starts alongside your BI tool as the causal model and accountability layer on top, so your dashboards keep doing what they do. Over time, though, most teams end up retiring their legacy BI tool once KPI Tree is the system of record for how decisions get made.
Do we need dbt?
No. Define metrics in SQL directly, or sync your catalogue from dbt (Core and Cloud), Looker, or Snowflake semantic views if you have one. Aggregation semantics are read automatically from dbt definitions, and semantic view measures are auto-discovered.

See it on your own metrics.