
KPI Tree

For humans · Map + Measure

Plan against reality. On the model that explains the gap.

Load budgets, forecasts and reforecasts as business models. They run through the same calculation pipeline as your actuals and land on the same causal tree, so every variance arrives with the drivers beneath it, each scored for confidence and statistical significance, and the named owner who can act on it.

Plan and actuals, calculated as one. Variance with the why attached.

One pipeline. No reconciliation. Same maths as your actuals

Business model values run through the identical calculation pipeline as your actuals: sums sum, rates average, balances carry their last value. Plan and reality cannot disagree about how a number was computed, at any granularity.

Variance that explains itself. Drivers, not rows

A miss is not a red cell in a report. It is a node on the causal tree, with driver edges beneath it carrying confidence and statistical significance, and a named Accountable owner beside it.

Monthly plan, daily answer. Ramp profiles

A budget written in monthly rows becomes a daily series through ramp profiles: flat, linear or weekday-aware, set per metric. You can read performance against plan mid-month instead of waiting for the close.

Variance analysis is not analysis. It is reconciliation.

The plan lives in a planning tool or a spreadsheet. The actuals live in the warehouse and the BI layer. The two carry different calendars, different aggregation logic and different owners, so the first week of every month goes on making them agree before anyone asks why they differ. Even when the budget is loaded into the warehouse, it shares no calculation logic with the actuals, so every comparison is hand-built and quietly fragile. KPI Tree treats the plan as a first-class citizen of the same model as the actuals, and the reconciliation step disappears.

Plan reconciliation loading

One calculation pipeline. Plan and reality can never disagree.

A business model maps your budget, forecast or target onto the same metrics your actuals flow into. From that moment the plan is computed by the identical pipeline: each metric's aggregation semantics are respected, values re-aggregate to daily, weekly, monthly, quarterly or yearly views, and plan sits alongside every comparison frame you already use. There is no parallel spreadsheet logic to maintain and no month-end argument about whose number is right. The question moves from which figure to trust to what to do about the gap.

Time travel timeline loading

Budget, reforecast, downside case. As many models as the year demands.
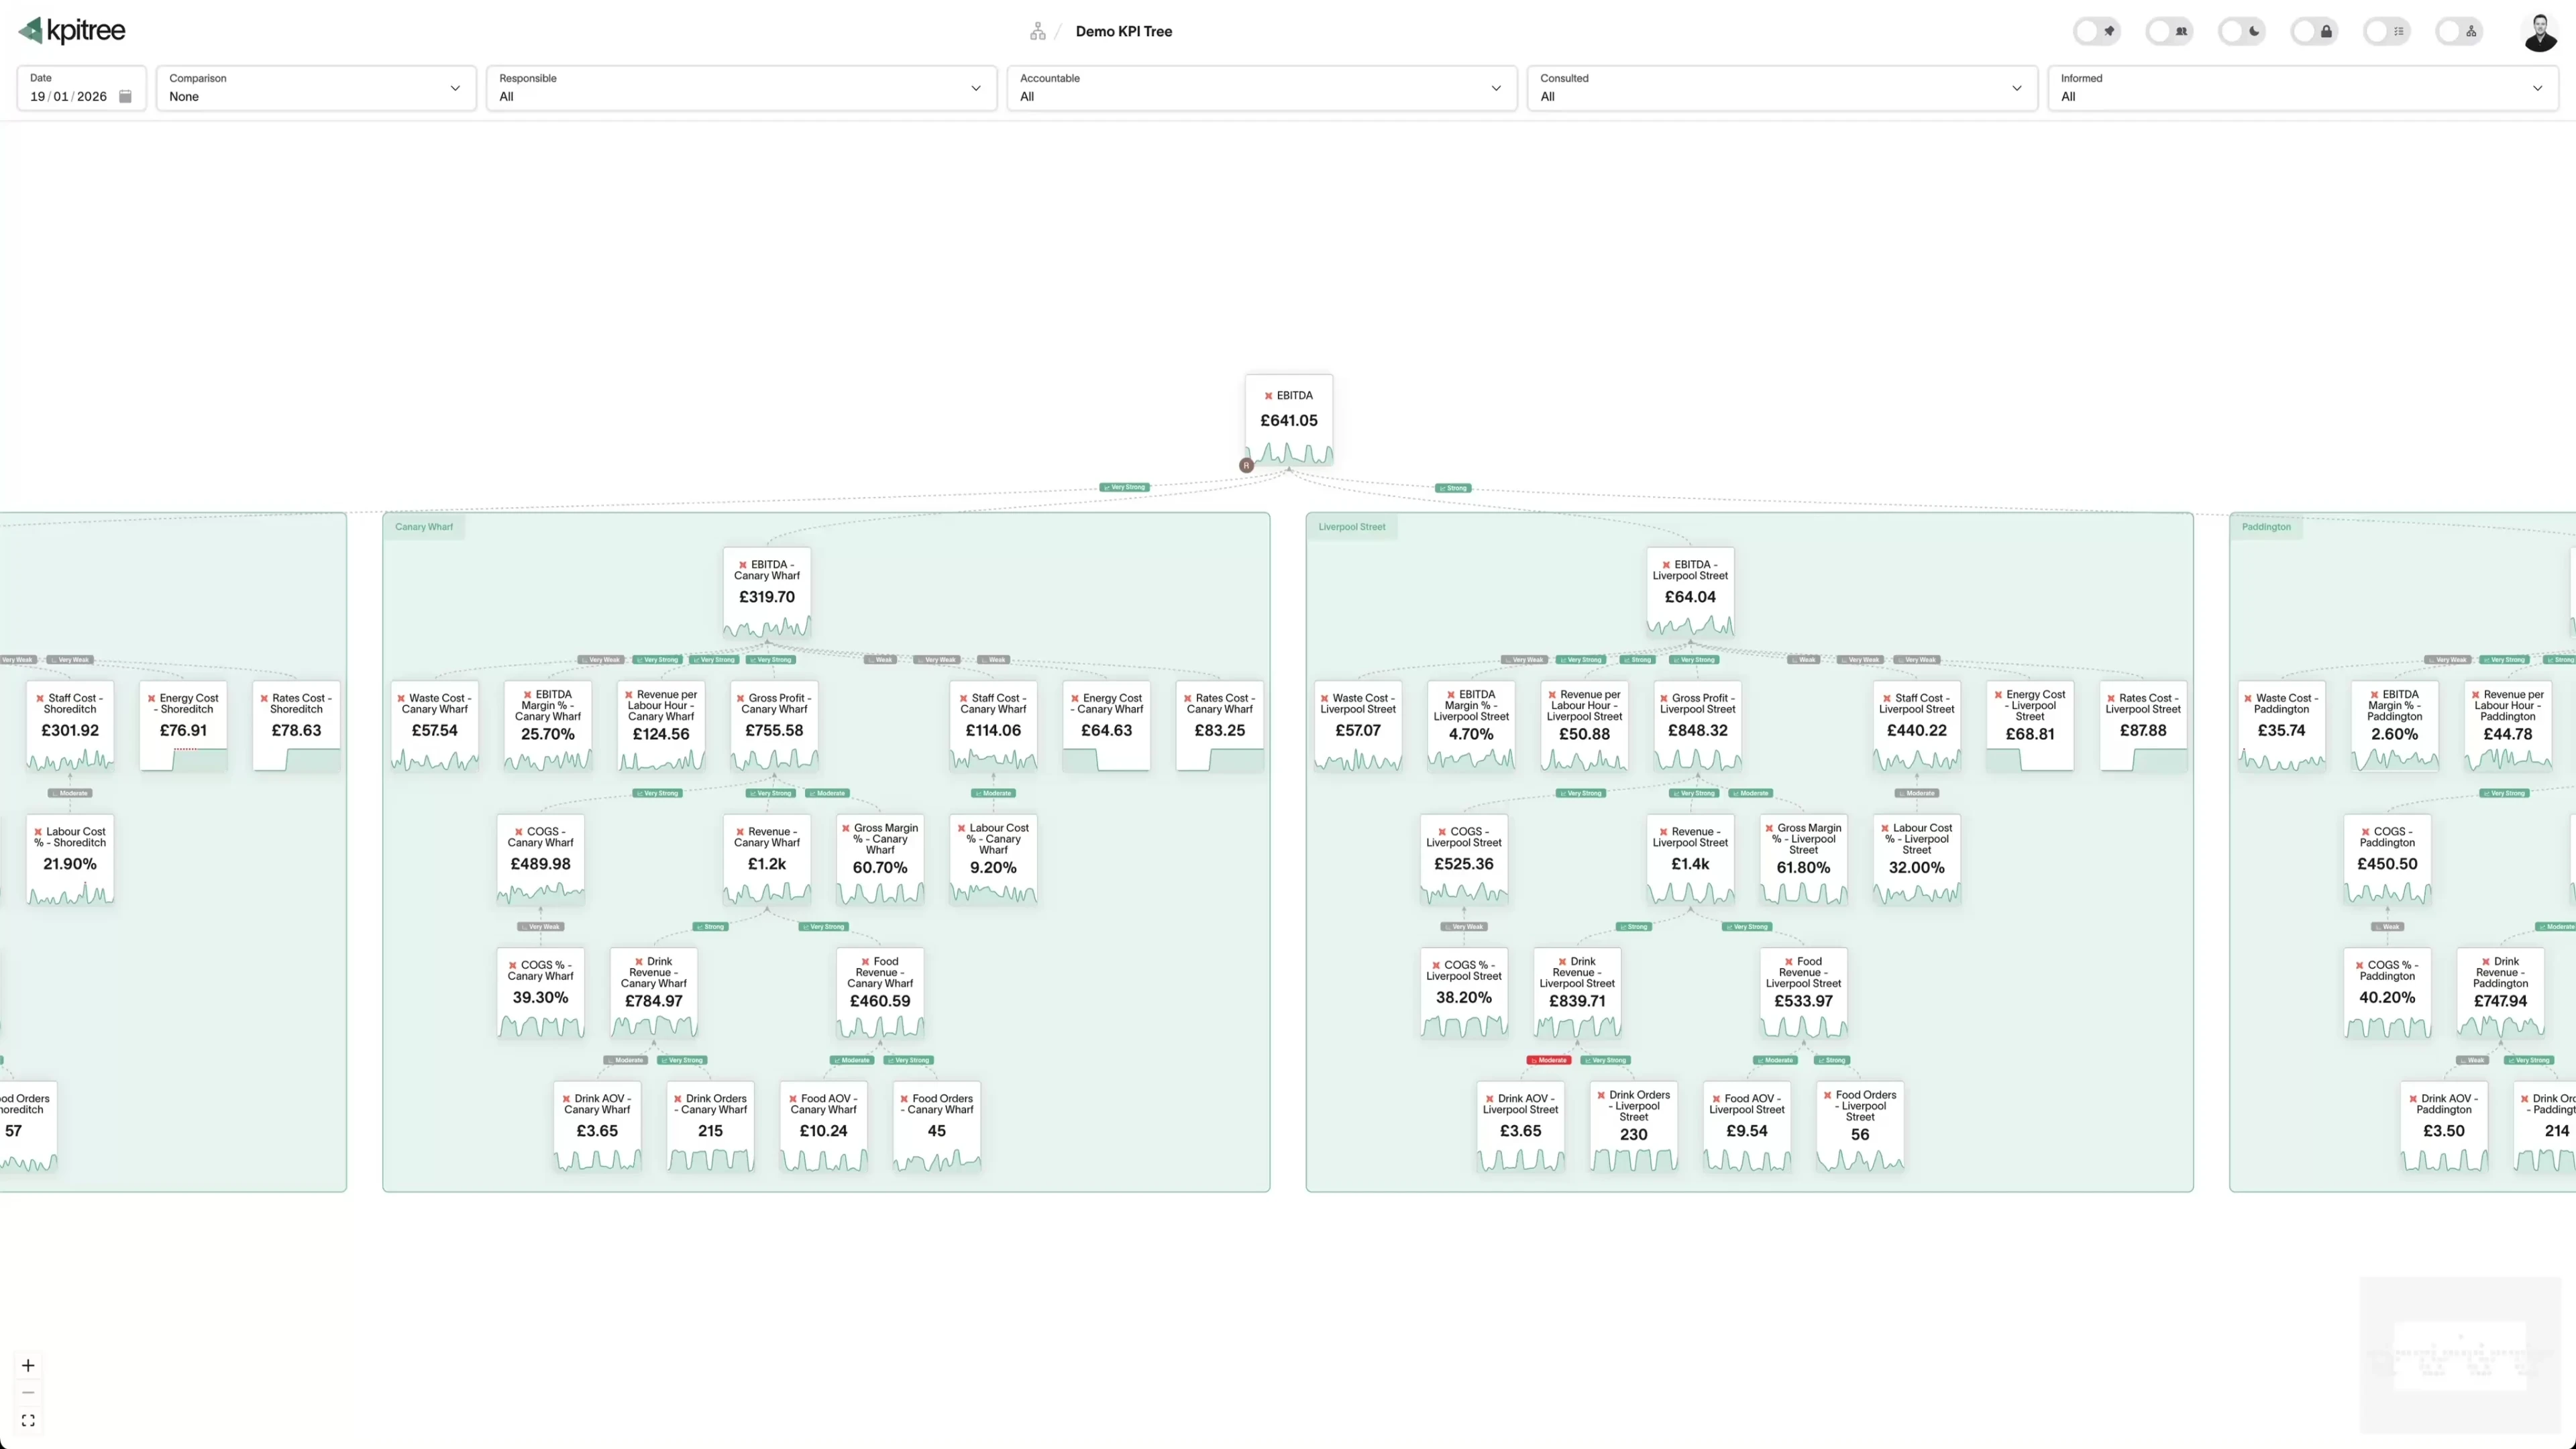
A year rarely survives on one plan. Each business model is named, described and given its own colour: the board-approved budget, the rolling reforecast, the downside case for the credit committee. The Q3 reforecast does not overwrite the original budget; both live alongside the actuals, and you switch between them on the canvas. The model overlays every node's chart and every grid view sparkline in its own colour, so when the reforecast lands, the whole business is looking at the same version of it.

The plan is monthly. The business is daily.

Budgets are written in monthly or quarterly rows, but the metrics they govern move every day. Ramp profiles turn sparse plan points into a daily series: flat carries the value forward, linear spreads the change evenly across the gap, and the weekday options skip non-working days. Each metric carries its own profile, so a product launch can ramp while a rent line stays flat. The result is a plan you can track against on the 14th of the month, not only at the close. And it is the same daily series that the strategy module reads: a key result checks its progress against it, and an initiative's budget is judged by it, so the plan on the tree and the target on the objective are never two numbers.

Ramp profile interpolation loading

The variance is a node on the tree. The explanation is beneath it.

In a report, a missed number is a row, and the explanation is a meeting. Here the missed number is a node on the causal tree, and beneath it sit its driver edges, each carrying confidence and statistical significance, retested against your data daily. You follow the chain from the P&L line that missed plan down to the operational metric that actually moved, and you arrive at a driver with a name on it rather than a theory.

Driver

Conversion rate

23%
Granger-causal · lag 3d · q < 0.05

Outcome · 58% contribution

Revenue

15%

A miss finds its owner. Before the board pack does.

Every metric in KPI Tree carries RACI ownership. When a period closes with a metric off its target, the period-close trigger fires, with the tolerance you set for how far it can slip, and pushes to the named Accountable owner with the driver behind the miss attached. The action they take is tracked against the metric, and the next close verifies whether it worked. Nobody discovers a variance for the first time in the quarterly review, and no miss dies in an unread report.

KPI Tree

KPI Tree app · 09:14

Revenue is 15% below target. Conversion rate is the primary driver (Granger-causal at lag 3d). @Sarah Chen you are Accountable.

View driversCreate task

Ask the agent whether you are on budget. It knows.

Plan context is part of Canopy, the business context layer your AI agents read over MCP. Budgets and reforecasts travel with the metrics they govern, computed by the same pipeline, so an agent asked about performance against plan answers from the numbers, with your permissions applied, rather than guessing which warehouse table might be the budget. What was planned, what landed, and who owns the gap are questions any sanctioned agent can now answer.

AI query examples loading

The budget funds initiatives. The portfolio shows the return.

A budget is not only targets to track against. Part of it is investment: the projects, launches and programmes meant to move the numbers. In KPI Tree that work is modelled as initiatives on the strategy map, each carrying its budget, actual spend, a named owner, milestones and the metrics it is meant to move, with the key results above them reading from the same pipeline as the plan. The portfolio view then lays the evidence across every funded bet: how far each targeted metric has moved since the work began, in the direction it intended, against the share of spend behind it. The quarterly investment review stops being a slide of status updates and becomes a chart that can separate a bet that is failing from one that is simply early, so finance can see where the money is working before deciding where it goes next.

Where the money is working

Bubble area = budget

Metric movement since each initiative started, signed by the direction it bet on.

Menu engineering programme
Rota optimisation rollout
+25%0%-25%

Share of portfolio spend

Double downToo early to judgeNot startedEvery initiative earns a verdict

Your planning tool builds the budget. This is where it meets reality.

KPI Tree is not where you build the budget; your FP&A tool and your planning models stay exactly where they are. A business model is where the finished plan lands so the loop can run on it: the actuals move, the variance surfaces with its drivers, the owner is pushed, the action is tracked, and the impact is verified before the next reforecast. Planning stays in your planning tool. Learning whether the plan survived contact with the business happens here.

Common questions

How does the budget get into KPI Tree?
A business model points a query at the connection where your plan already lands, picks the date column, and maps each plan column onto the same metric your actuals flow into. Each mapping carries its own aggregation and an optional ramp profile, and a preview shows the resulting series before you save.
Can we hold more than one plan at the same time?
Yes. The approved budget, the rolling reforecast and any scenario cases are separate named models, each with its own colour. They sit alongside the actuals rather than replacing each other, and you switch between them directly on the canvas.
Our budget is monthly but our metrics are daily. Does that work?
Yes. Ramp profiles interpolate sparse plan points into a daily series: flat carries the last value forward, linear spreads the change evenly, and weekday-aware options skip non-working days. Every metric can carry a different profile.
Does this replace our FP&A or planning tool?
No. Budgets and forecasts are still built where they are built today. KPI Tree is where the finished plan meets the actuals on one causal model, where the variance gets explained, and where the response gets owned, tracked and verified.
How does the owner of a missed number find out?
The period-close trigger fires when a metric ends its period beyond the tolerance you set against its target, and the push goes to the named Accountable owner with the driver behind the miss attached. If nothing happens, escalation follows the live org chart.
Can AI agents see the plan?
Yes. Business models are part of Canopy, the business context layer agents read over MCP, so an agent can answer what was planned, how the actuals compare and who owns the gap, computed by the same pipeline as every other number and scoped to your permissions.
Do targets and key results use the same numbers?
Yes. Targets and the key results on objectives read from the same calculation pipeline as business models and actuals, so a target hit, a plan variance and a key result's progress are never three different versions of the truth.
Can finance see whether funded work paid back?
Yes. Initiatives carry their budget and actual spend alongside the metrics they were meant to move, and the portfolio view reads each targeted metric's movement, in the direction the initiative bet on, against the share of spend behind it. The investment review starts from that evidence rather than from status updates.

See it on your own metrics.