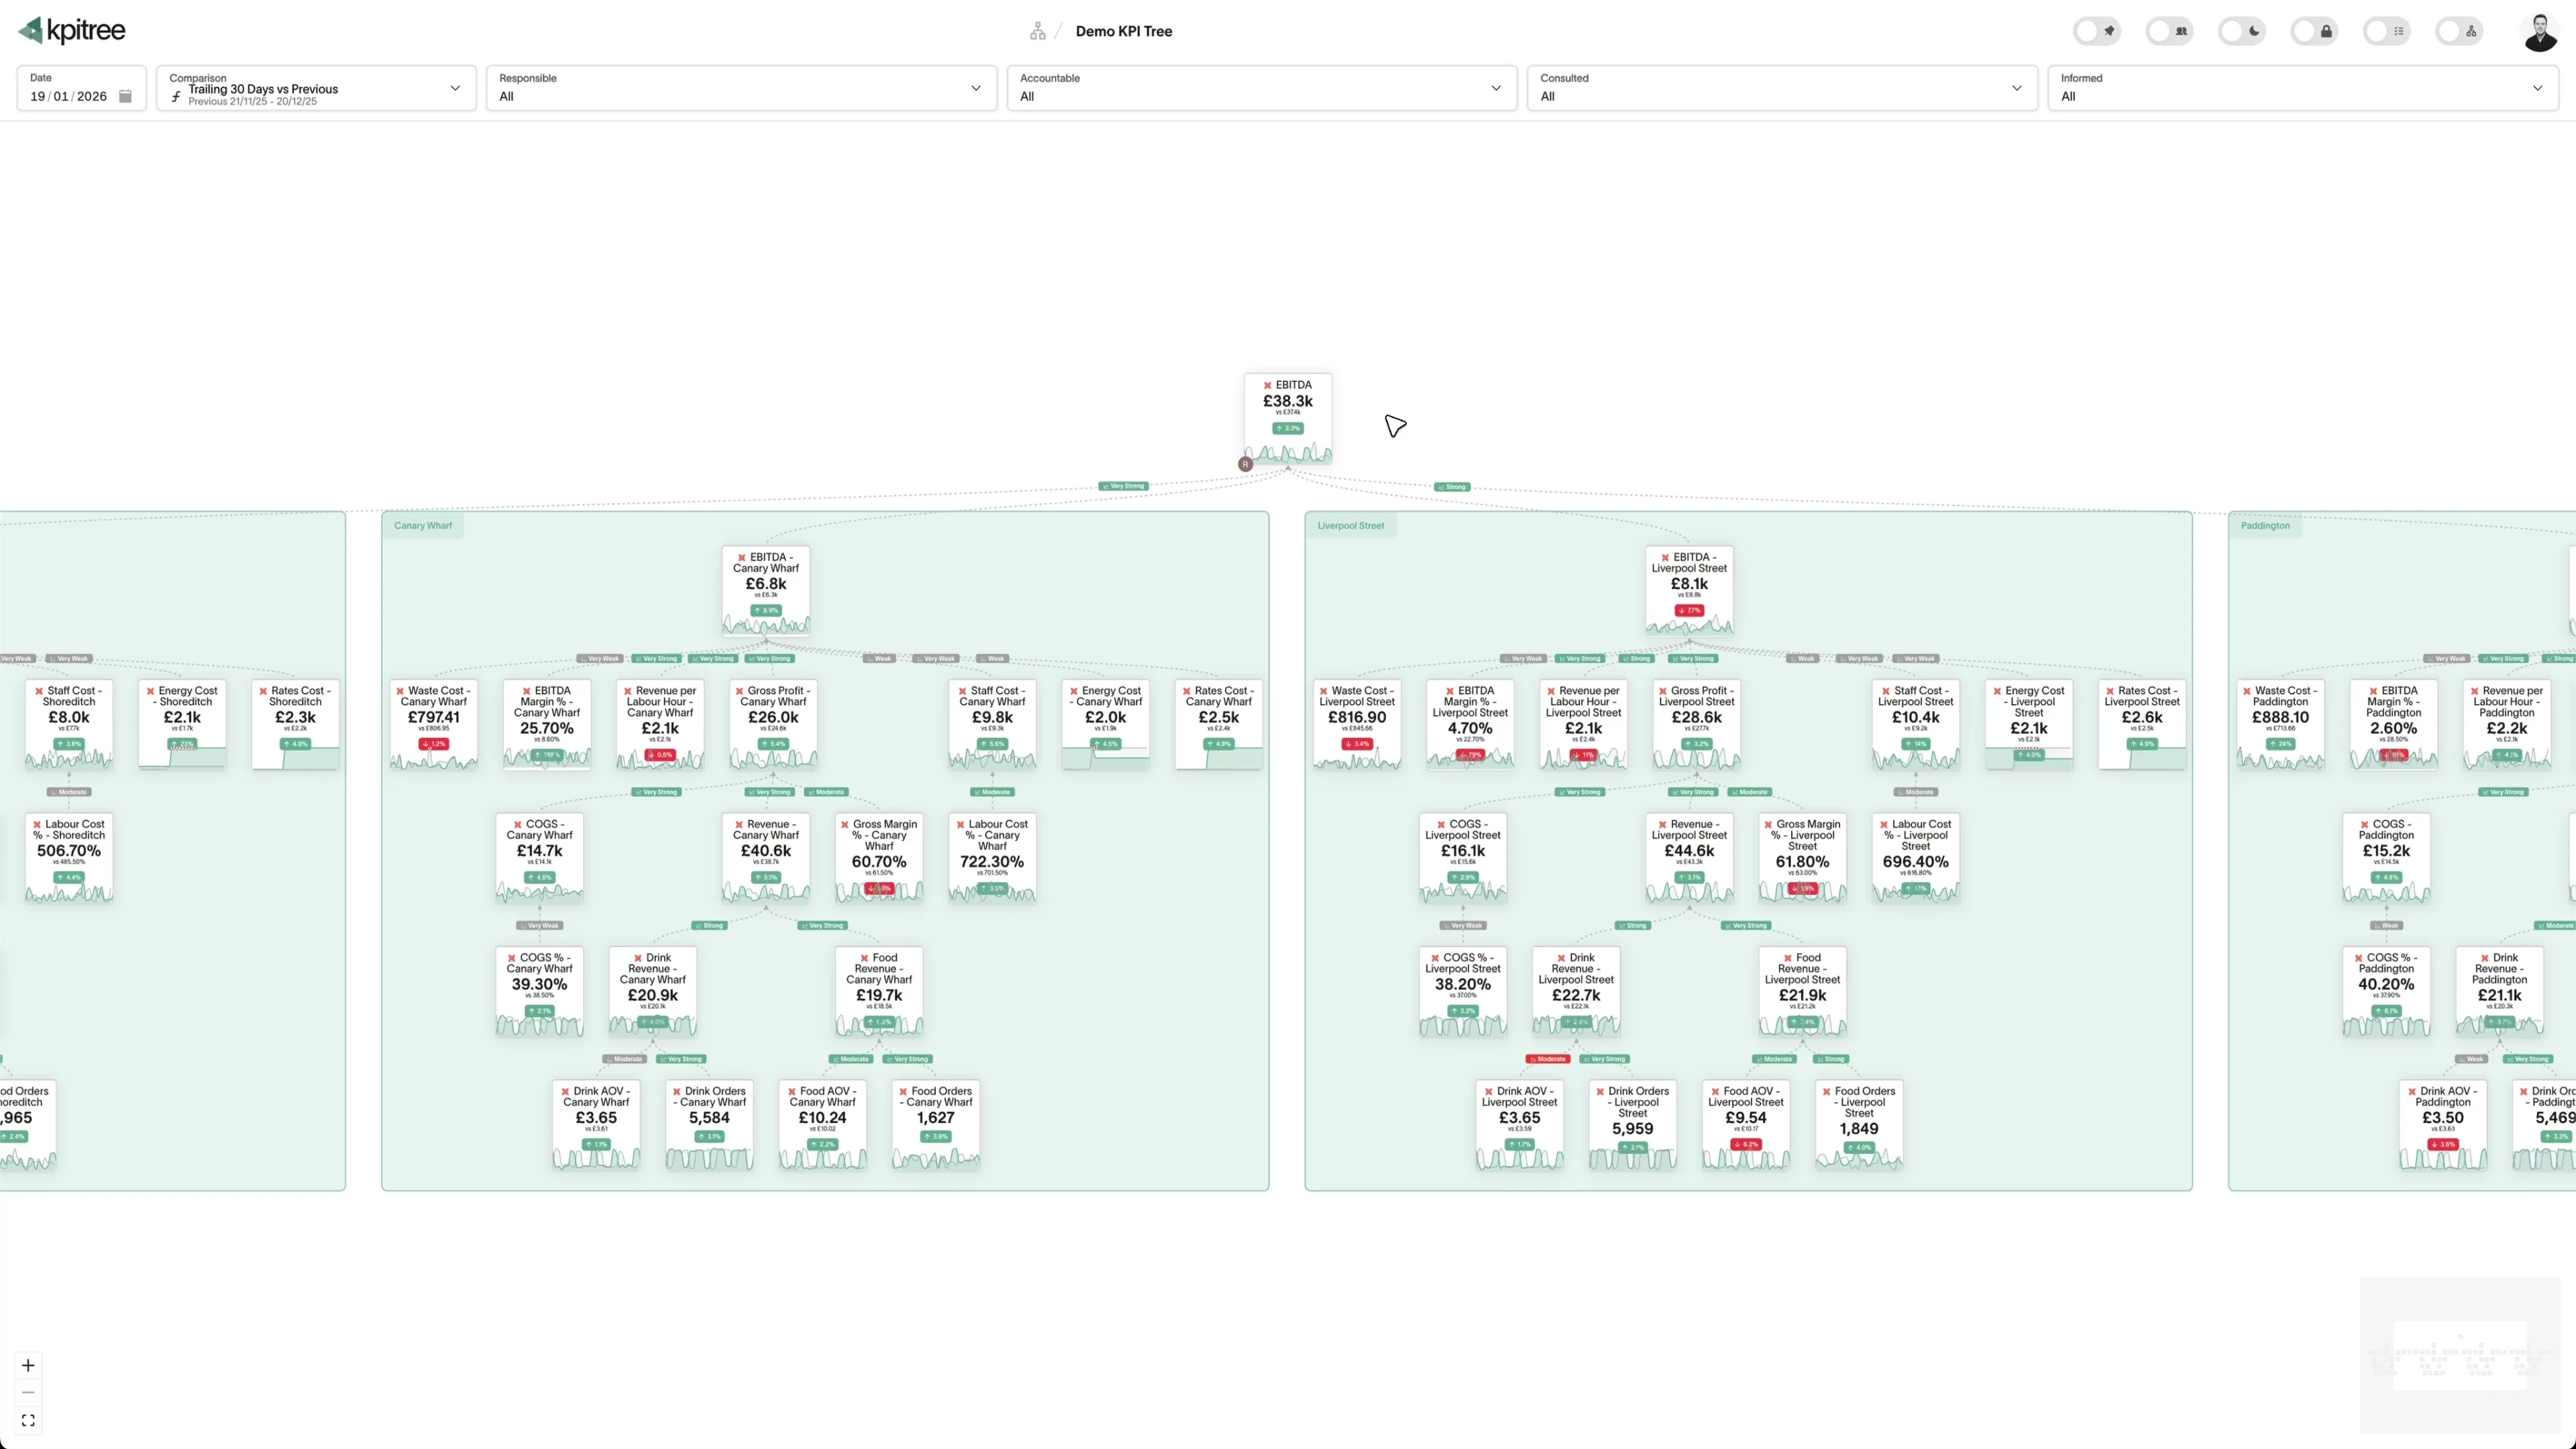
KPI Tree

For humans · Prove

Why did it change? Answered.

Impact-ranked drivers with confidence levels and statistical significance, traced down the whole tree in seconds. Statistical driver signals, not unfounded causal claims.
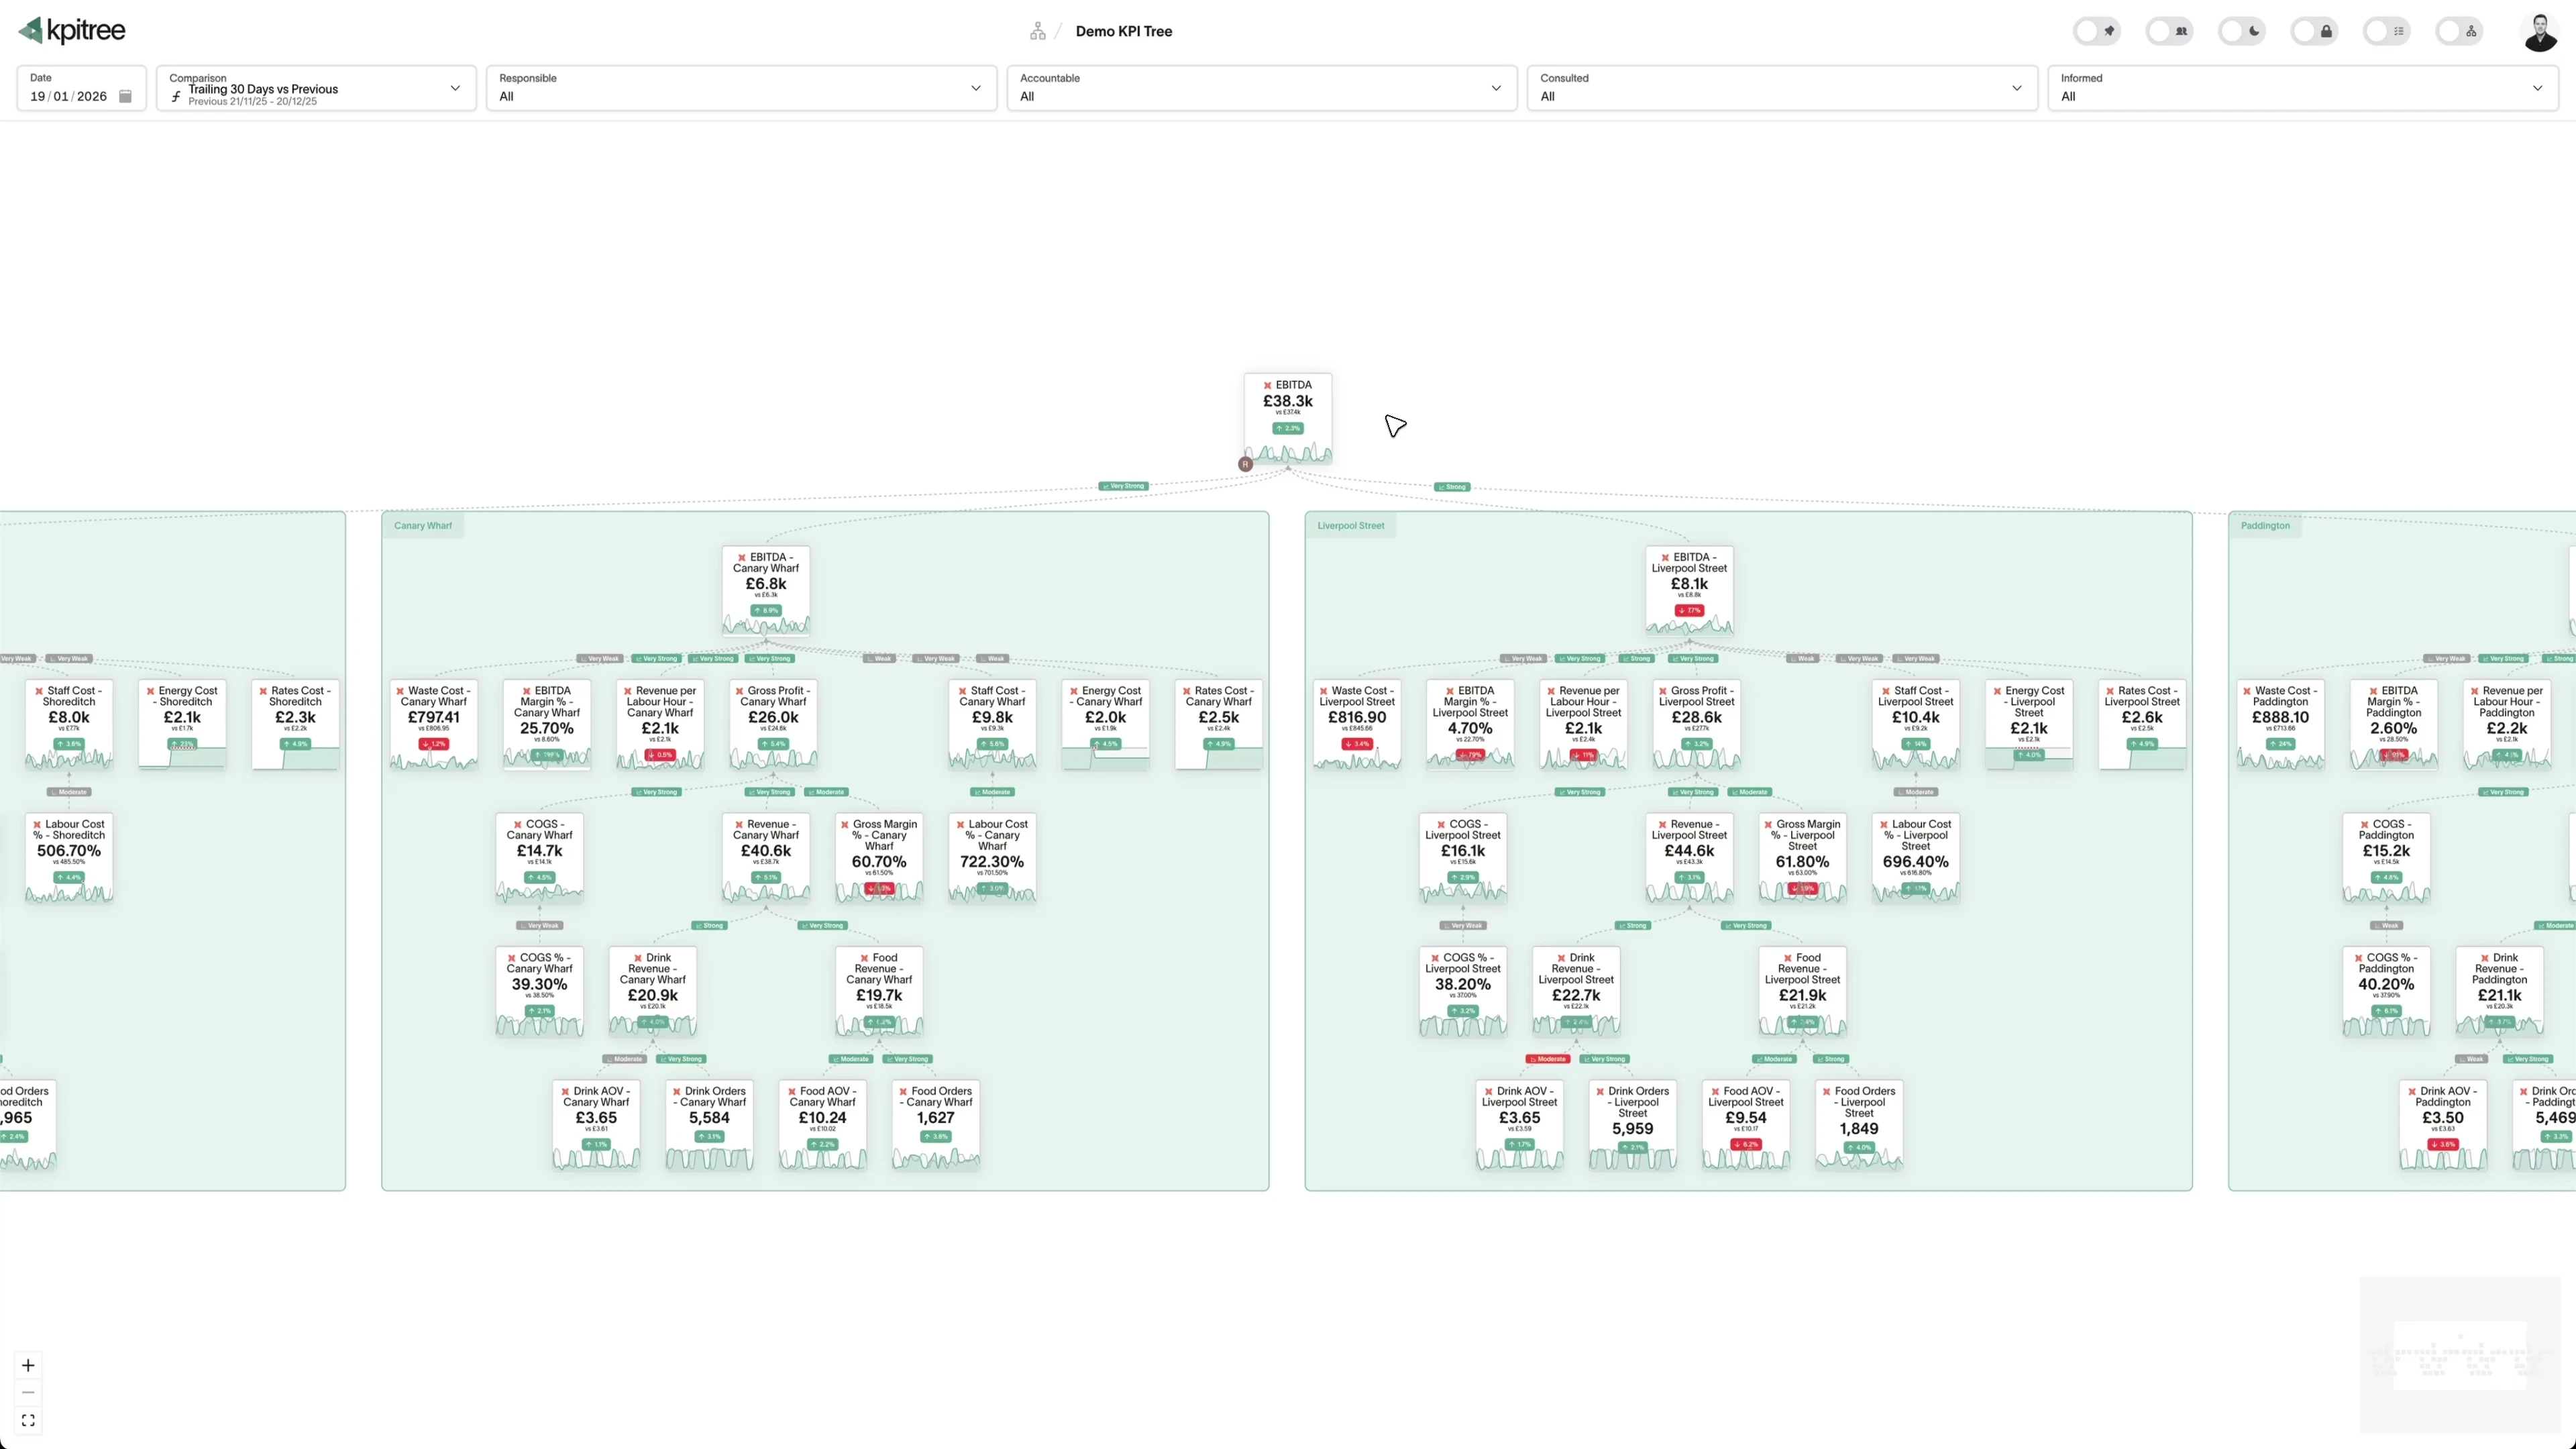
Why did it change? Answered before the meeting starts.

Drivers ranked by impact. Statistics attached

Every contributing driver ranked by impact and depth, with confidence and significance from tests that run daily.

The whole chain, not one hop. Full causal lineage

Trace any change level by level to the input that actually moved, with each driver's contribution quantified.

Explainable and attributable. Not a black box

The model is on the canvas, the confidence is stated, and every edit to the tree is recorded and attributable.

Drivers ranked by impact, with the statistics attached

Any AI can offer a theory about why revenue dipped. The difference is whether the theory is tested. When a metric moves, every contributing driver is ranked by impact and depth, with confidence levels and statistical significance on each relationship, computed by tests that run daily across your data. You see which drivers matter, how sure the model is, and where coincidence ends, so the first answer is the right place to look.

Root cause analysis loading

Grounded in your warehouse, guided by the tree

When AI investigates a metric, it queries your warehouse directly, so answers come from row-level data rather than pre-aggregated values. But any AI can query a warehouse; without structure it is fishing, running exploratory queries and narrating whatever pattern surfaces. The tree constrains the search: the AI investigates the driver edges the daily tests have already scored, inheriting every false positive your team has pruned. It investigates where evidence points instead of guessing, and its working is inspectable, because its working is your data plus a causal model you can see.

Compute engine loading

See exactly what each driver contributed

Waterfall change insights decompose a metric movement into what each driver added or removed, colour-coded against goal. Revenue is down 8 percent stops being a sentence and becomes an attributable breakdown in one view, which is the difference between a status update and a decision input.

Driver

Conversion rate

23%
Granger-causal · lag 3d · q < 0.05

Outcome · 58% contribution

Revenue

15%

The Five Whys, pre-answered

Trace any change down the complete upstream lineage, level by level, all the way to the input that actually moved. Not one hop, the whole driver chain to the root. The interrogation that normally takes a week of meetings is already done when the meeting starts.

Ask across the whole tree

Analysis is not confined to a single metric. Ask what is driving the revenue decline across all regions and get an answer that connects insights across teams, because the tree spans them. Proactive alerts surface anomalies and emerging trends without being asked, so the cross-functional why that normally needs an analyst arrives before the meeting does.

KPI Tree

KPI Tree app · 09:14

Revenue is 15% below target. Conversion rate is the primary driver (Granger-causal at lag 3d). @Sarah Chen you are Accountable.

View driversCreate task

Test what drives growth. Statistically.
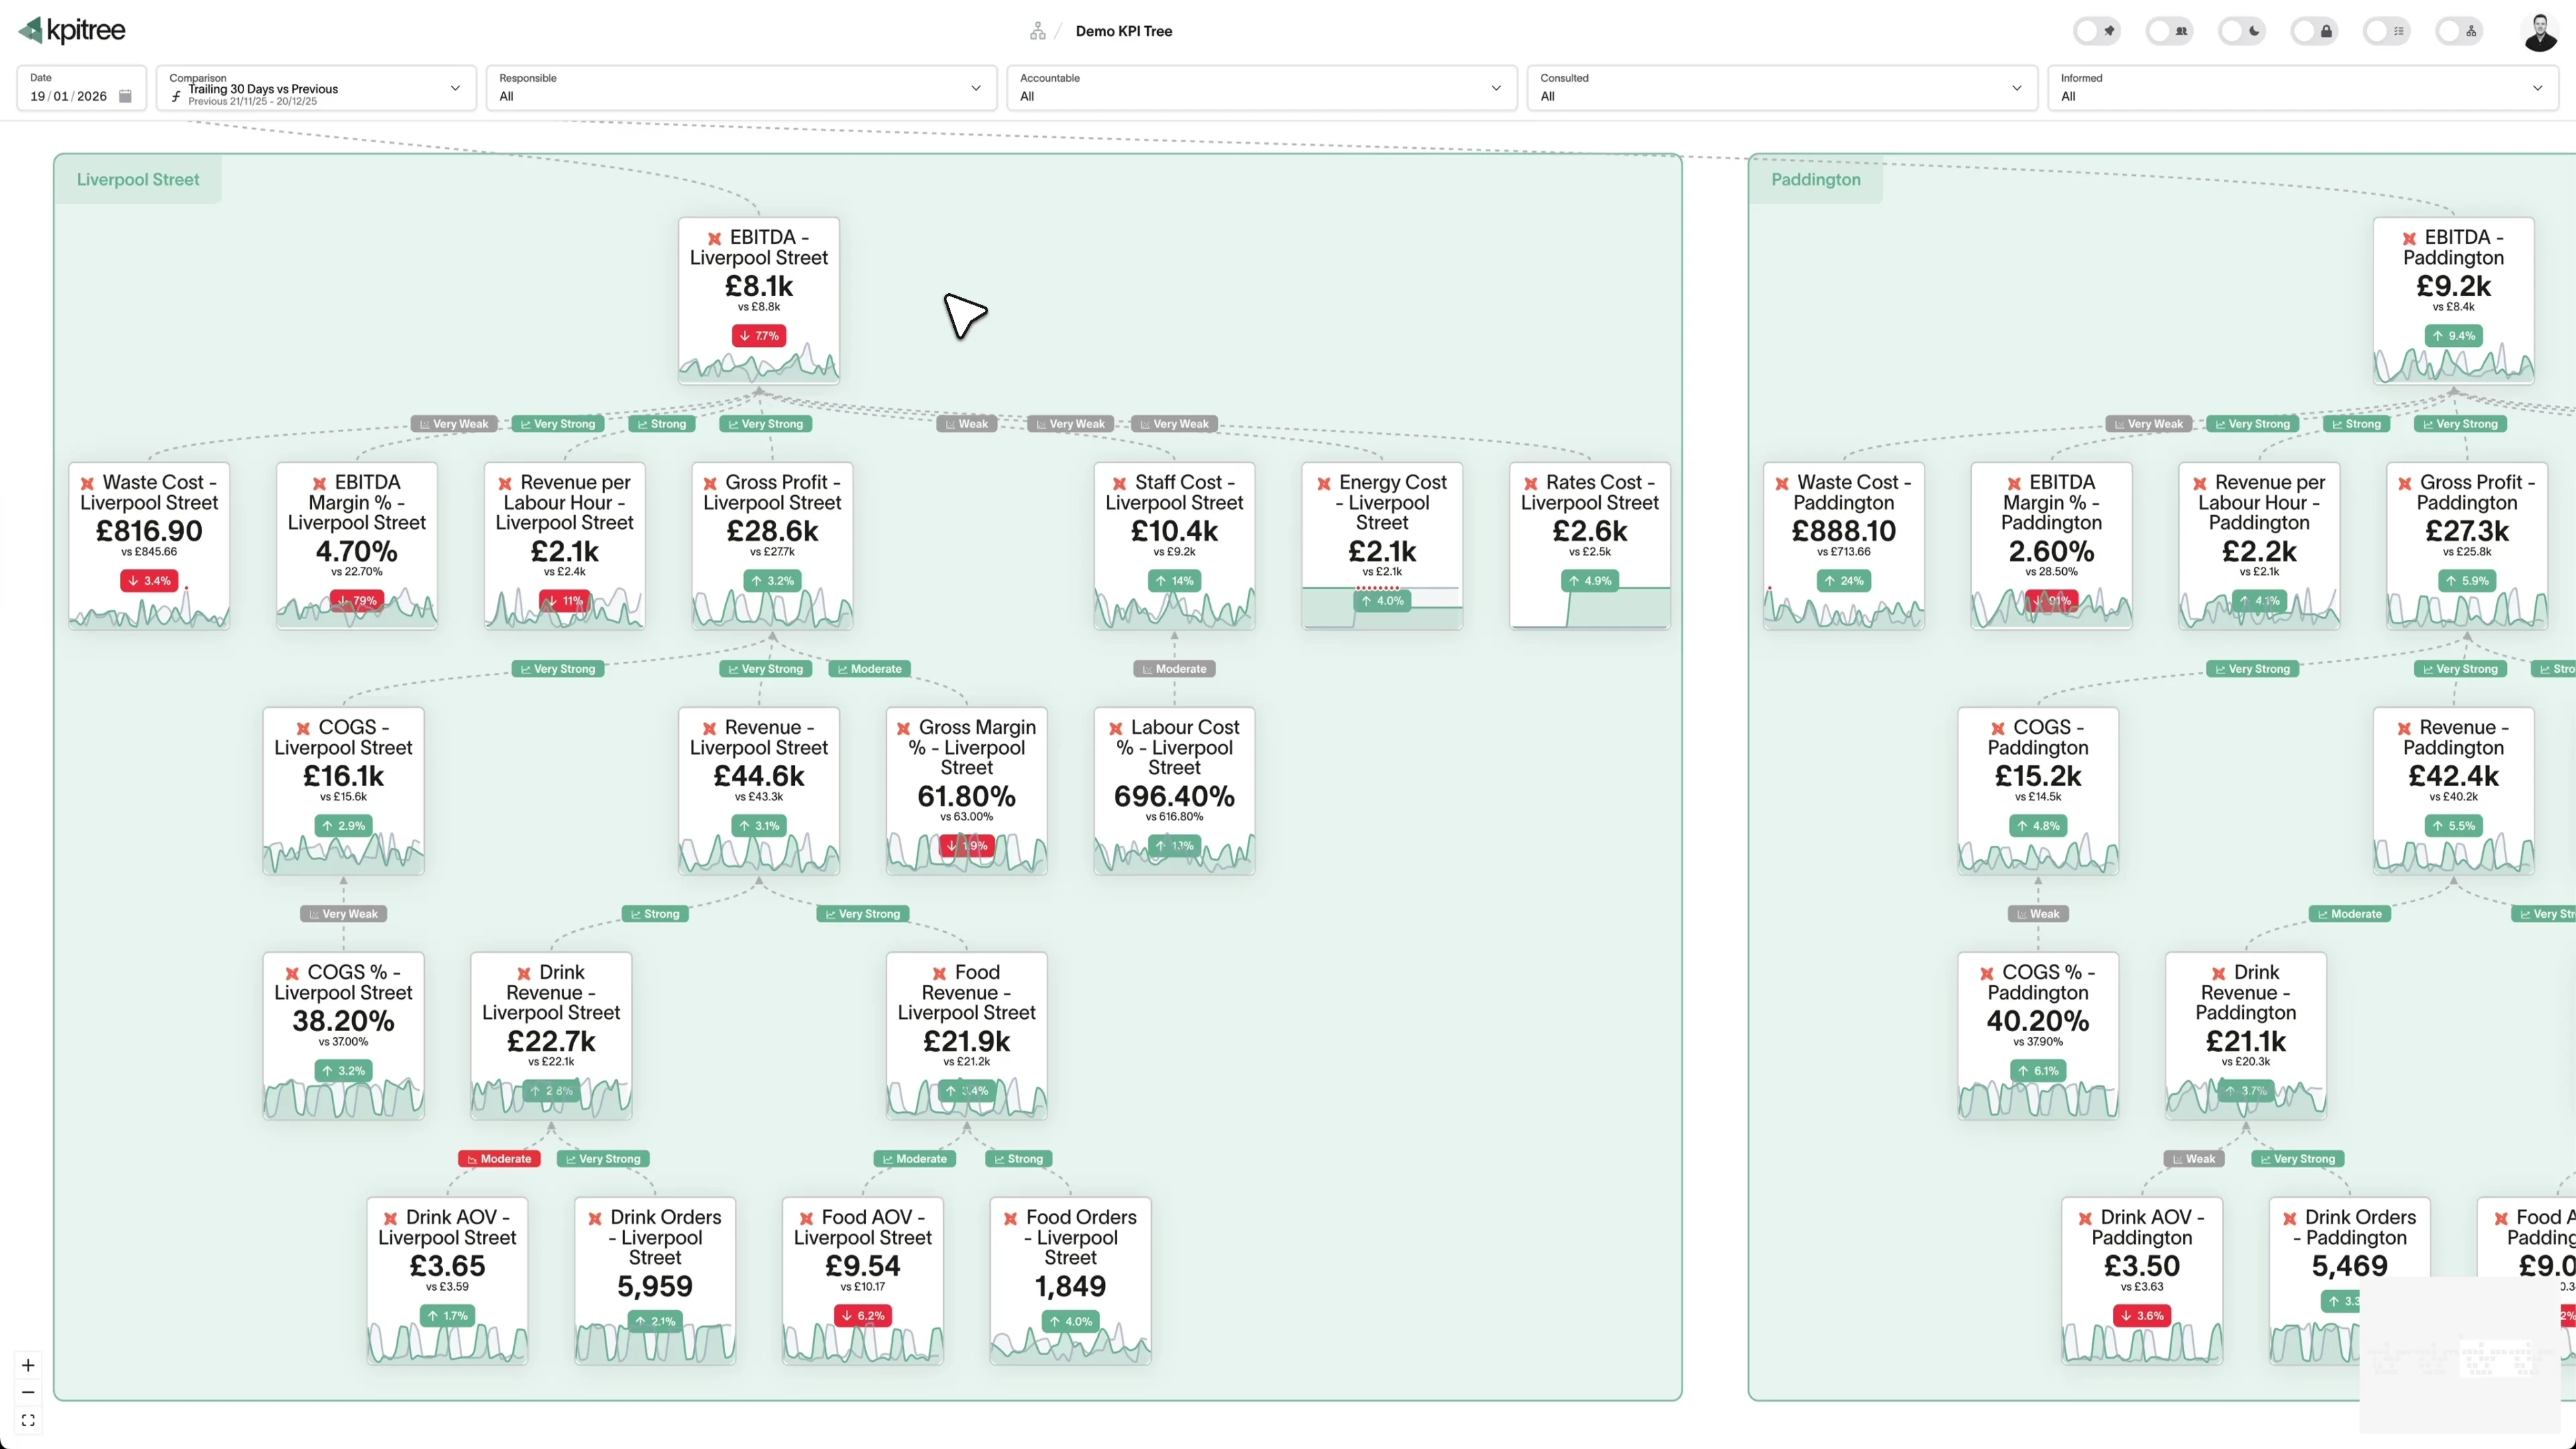
Turn assumptions into evidence. The belief that discounting drives churn, or that response time drives retention, gets run daily through proprietary ML models and statistical tests, from Pearson correlation through Granger causality with BH-FDR correction, rather than defended in a meeting. The result comes back with strength, lag and significance attached. No data scientist required.

Go deeper when you need to

The Analyst view puts SQL and the underlying tables on the canvas, so the data team can validate every number the exec view shows without leaving the tree. Snowflake users can go further and ask questions in plain English, with the SQL generated and run by the warehouse capability they already license. Trust is built by letting the sceptics check.

REST API loading

Explainable, not a black box

The causal model is visible, the confidence is stated, and people can edit the tree, pruning correlations they know have no causal link. Every edit is recorded and attributable, so you can see who pruned what, and when. AI drafts, humans correct, evidence decides. That is what makes an answer defensible in a leadership meeting: not that an AI said it, but that the reasoning is on the canvas for anyone to inspect.

causal · q < 0.05lag 3dq < 0.01Revenue-15%Conversion-23%Traffic+2%AOV-4%Checkout-31%PricingPaidOrganicBasket sizeDiscountsPayment errorsPage speed

An answer nobody owns is still noise

Diagnosis is table stakes now; every vendor's AI can offer a why. What happens next is the product: KPI Tree routes the answer to the named Accountable owner with the driver context attached, escalates if nothing happens, and verifies whether the action moved the number. That is where the loop actually closes.

Conversion rate

Marketing · daily

R
A
C
+4
I

Common questions

How is significance calculated?
Proprietary ML models and statistical tests, recalculated daily as new periods land, from Pearson correlation to Granger causality with BH-FDR correction. Each driver relationship carries the resulting strength, lag and significance, so the answer states how sure the model is.
Is this causal or correlational?
Correlation is only the first gate. Every driver relationship passes daily through proprietary ML models and statistical tests, through Granger causality with BH-FDR correction, before it is reported as a driver. Human edits then remove relationships the statistics cannot rule out. We tell you how sure the model is rather than overclaiming.
Why not just point an AI at the warehouse?
You can, and for one-off questions it works. But an unconstrained agent re-derives the structure of your business on every question and narrates correlation as causation. The tree gives the AI a tested causal model to investigate within, so answers are consistent, attributable and inherit every false positive your team has pruned.
Root cause vs anomaly detection?
Anomaly detection tells you something moved. Root cause analysis tells you what moved it, ranked by contribution, with the lineage to prove it.
Does the AI hallucinate insights?
Answers are grounded in row-level warehouse queries and the statistical model, and every claim is traceable to the tree. If the data does not support an answer, you see that too.
Does it work without dbt?
Yes. Root cause analysis runs on the tree, however your metrics are defined.

See it on your own metrics.