

 Amazon Redshift Integration
Your Redshift cluster already holds the numbers. KPI Tree adds the layer above it: what drives what, who owns each one, and whether the last action moved it.
You chose Redshift because the economics made sense, and KPI Tree keeps them that way. Each metric syncs with a single scheduled query, and everything downstream is computed off-warehouse in our own engine.You chose Redshift because the economics made sense, and KPI Tree keeps them that way. Each metric syncs with a single scheduled query, and everything downstream is computed off-warehouse in our own engine. Fifty users or five hundred, your cluster spend stays flat and your analysts keep their query slots. On top of that data, KPI Tree builds causal metric trees with statistical significance on every driver, RACI ownership at every level, action plans routed to the person who can move the number, and verified proof of whether the action worked. Redshift stays exactly as configured. KPI Tree reads it as a source.
Connected in under an hour
Create a read-only user
The wizard generates copy-paste SQL that creates a dedicated Redshift user with SELECT-only access on the schemas you choose. By default the username is KPITREE and the wizard auto-generates a 25-character password. Grant access to exactly the tables and views your metrics need and nothing more, so the connection can never write to your cluster.
Authenticate and connect
Provide your cluster endpoint, port (default 5439), and database name. The AWS region is parsed automatically from the endpoint. Choose password authentication with the credentials the wizard generated, or IAM authentication, which calls get_cluster_credentials to issue temporary database credentials from your existing AWS identity. SSL is set to require by default. KPI Tree runs a live SELECT to validate the connection before you leave the setup screen, so you know it works and the grants are correct.
Define metrics and start acting on them
Write metrics directly in SQL against any table or view in the cluster, each returning a daily series that KPI Tree syncs on a schedule. If your team already governs definitions in dbt with models materialised in Redshift, connect dbt Cloud or dbt Core as a separate source and KPI Tree reads those definitions instead of asking you to rewrite them. From there, map how metrics drive each other, assign ownership, and close the gap between knowing what happened and doing something about it.
Deep integration with Redshift
Two authentication paths, one setup wizard
One scheduled sync per metric, analytics off the cluster
PostgreSQL wire protocol, Arrow-native transfer
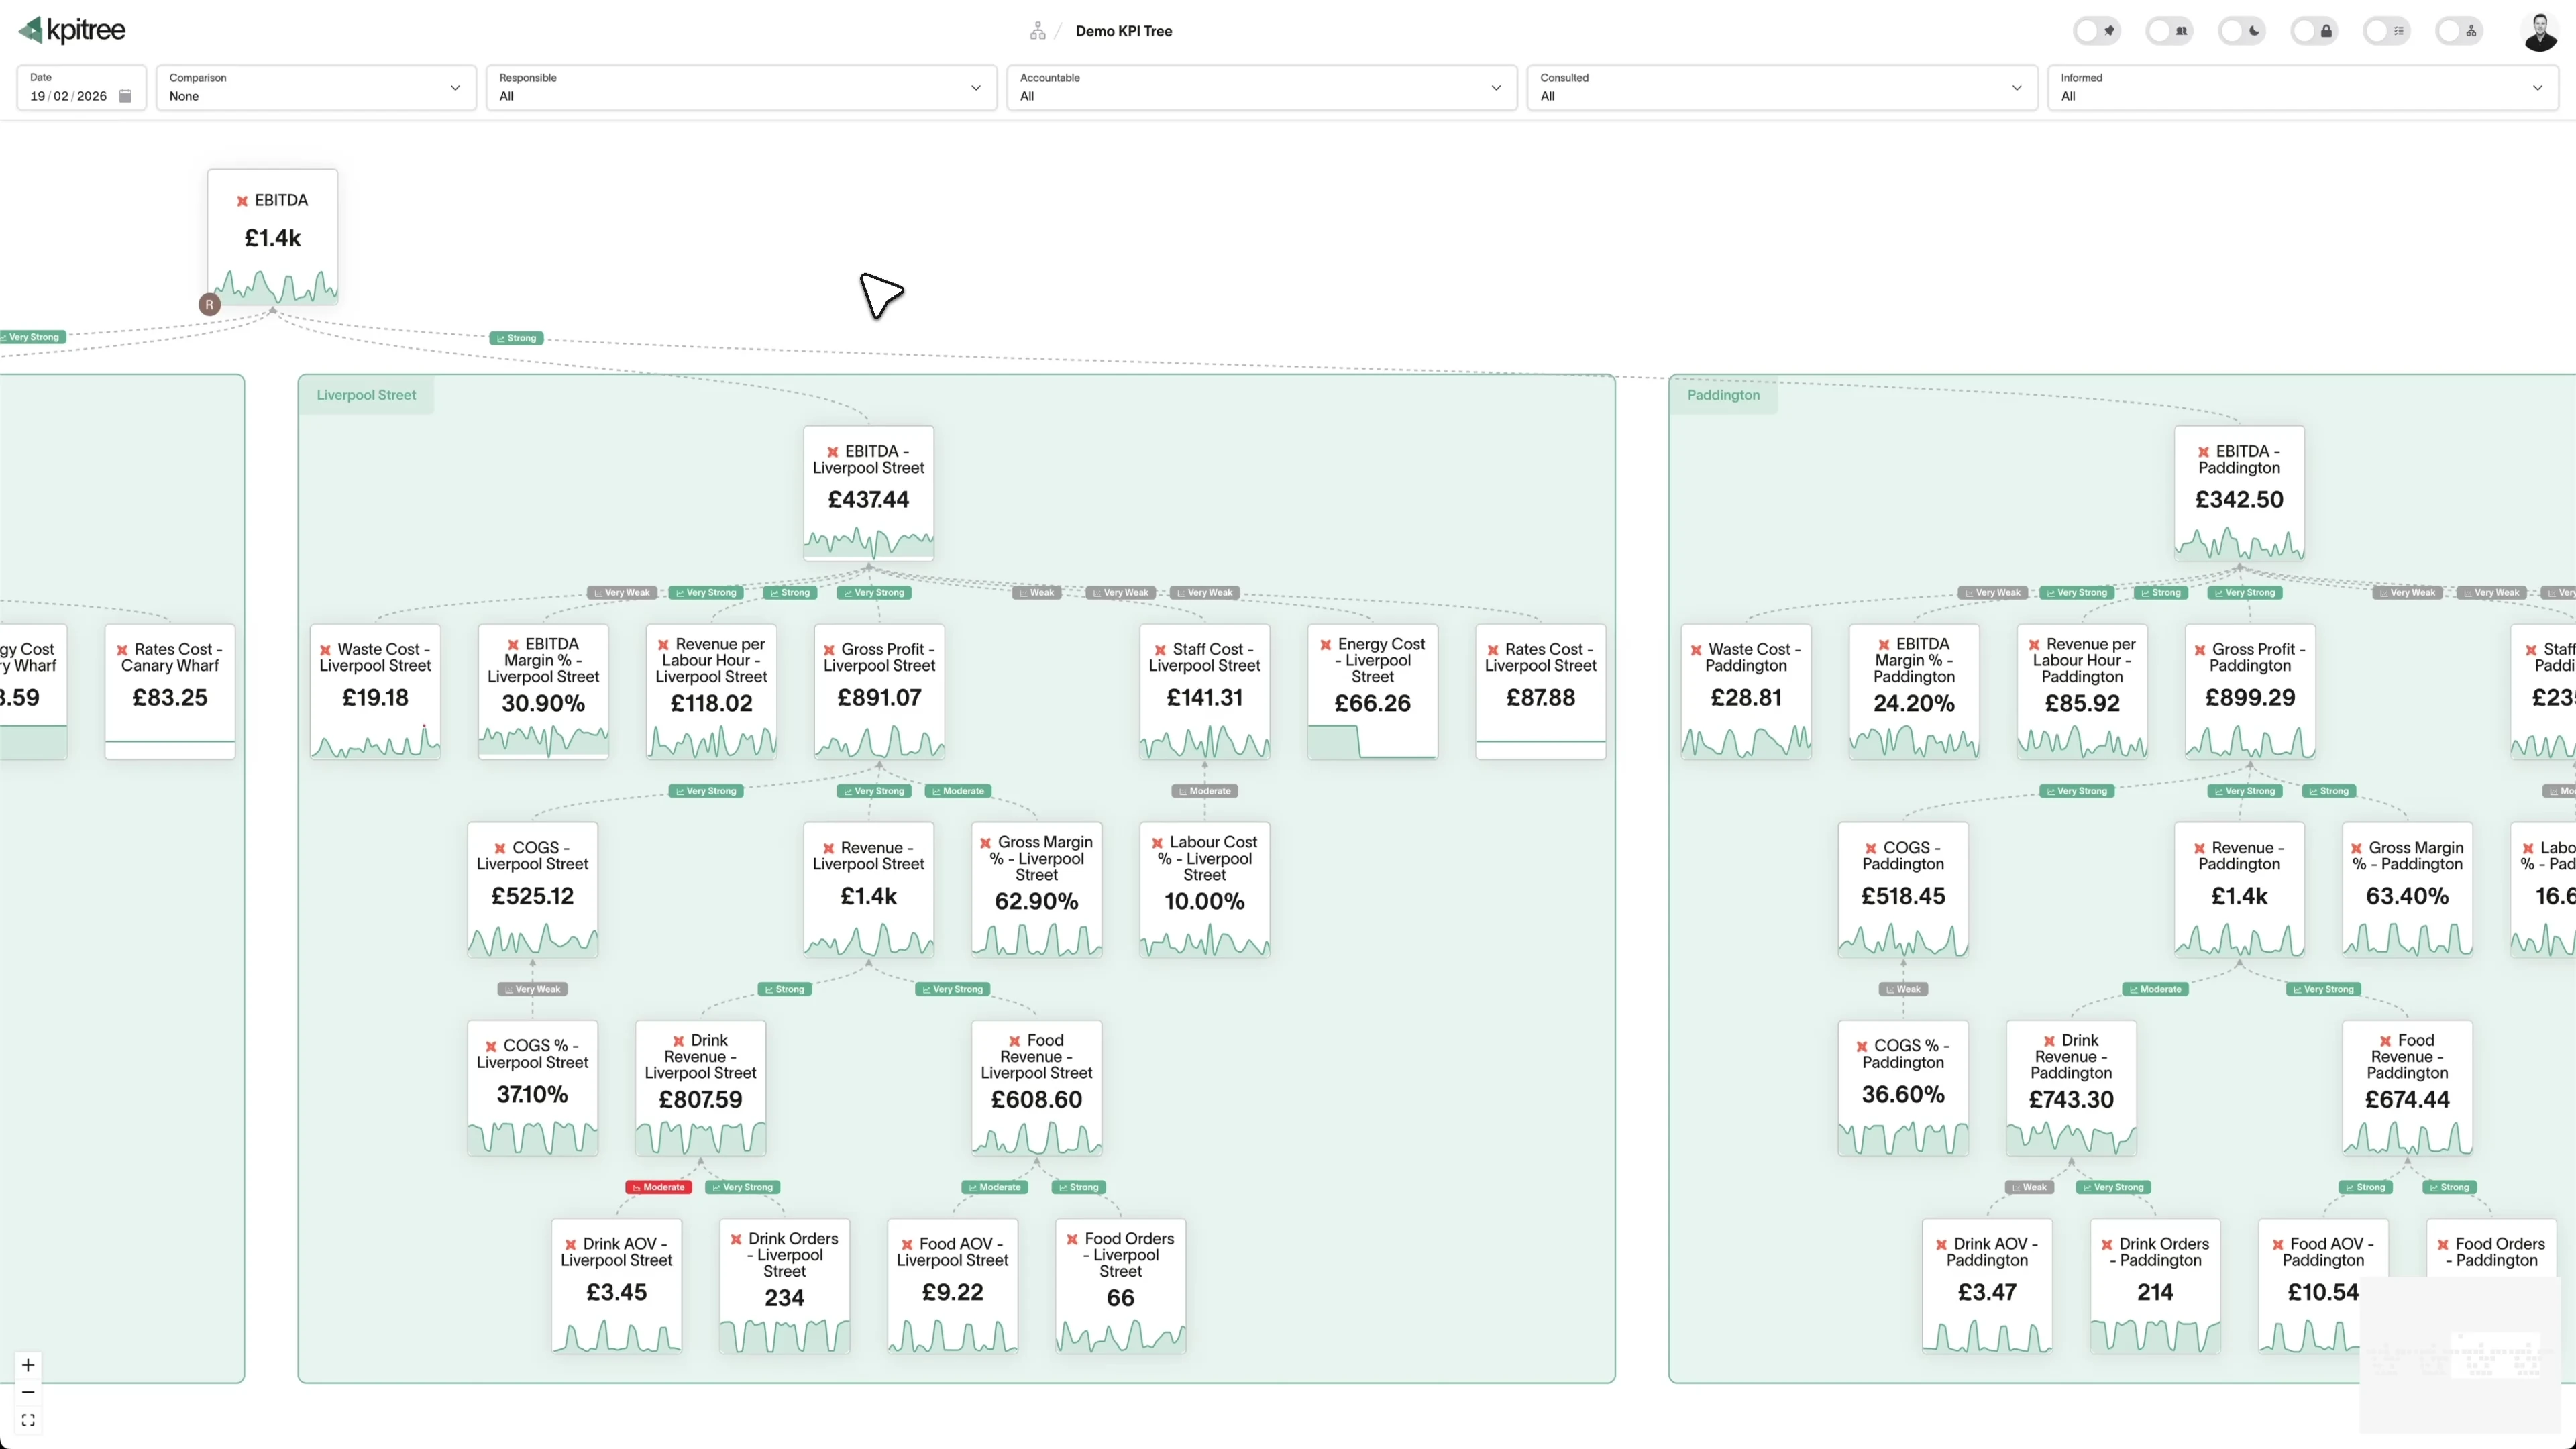
A causal metric tree, not another dashboard.
- Metric trees map how each driver moves the level above it, up to your top metric
- Statistical significance and confidence on every driver edge, not a hand-drawn diagram
- RACI ownership at every level so accountability is never ambiguous
- Anomaly-triggered alerts reach the accountable owner, and impact is verified after the fact
Password or IAM. Your security team picks, the wizard handles the rest.
- Password auth with auto-generated 25-character credentials and SSL require
- IAM auth via get_cluster_credentials for one-hour temporary credentials
- IAM role ARN, automatic role detection, or direct access key and secret
- Region parsed from the cluster endpoint, port 5439 by default
Warehouse connection
ConnectedRead-only access · credentials never leave the encrypted store
One query per metric. No extra queries for comparisons, rollups, or drill-downs.
- One scheduled query per metric, not one per user interaction
- All comparisons, rollups, correlations, and outlier detection run off-warehouse
- No need to enable Concurrency Scaling to serve more viewers
- Interactive filtering, period comparison, and drill-down are served from cache
Bring the dbt definitions you already govern.
- dbt Cloud or dbt Core connects as a separate source, not a button on the Redshift wizard
- Definitions, dimensions, time grain, and aggregation type read from the dbt model
- Define metrics in SQL against Redshift, or from your dbt semantic layer, your choice
- KPI Tree consumes your definitions and never asks you to rebuild them in a second tool
How KPI Tree sits on top of Redshift
Most tools treat your cluster as a compute engine that gets hammered on every interaction. KPI Tree treats it as a source: metrics sync on a schedule rather than on every click, and everything downstream runs in its own engine, so it can build the accountability layer above the data that no warehouse or BI tool provides.
Data warehouses
The numbers






Semantic layers
The definitions



Business apps
Launches, decisions, blockers




Org structure
Directory-synced




For humans
Answers, briefings and pushes
 @
@Read and write over MCP
Anthropic: 21% → ~95% with curated context



Canopy Agentic Workflows the metrics start them, humans gate them
Canopy Agents four out of the box, any model, your keys
Canopy
The business context layer
Structural context The causal tree, the org chart
Temporal context What was true when, plan against actual
Behavioural context What people did, what worked
Operational context RACI, workflows, approvals
Strategic context Objectives, key results, initiatives
Map & Measure
Metric Trees
Business Models
Prove & Act
Root Cause
Ownership
Verified Impact
Strategy
Grounded in proven causality
Verified proof
Meta spend → Revenue, +£32k vs forecast, q < 0.01
Personalised Action Plans 31 experiments running
hypothesis → a real person’s plan → measure the change
Causation the test cascade
ADF p 0.02 → Granger p 0.003 → q < 0.05, 87 of 1,204 survive
Correlation
22,791 pairs tested nightly, NPS – Churn r 0.71
Data warehouses
The numbers
Semantic layers
The definitions
Business apps
Launches, decisions, blockers
Org structure
Directory-synced
A source, not a compute target
The layer above the semantic layer
One tree across every source
Related integrations. More sources that work with KPI Tree.

Common questions
What connection details does KPI Tree need for Redshift?
Your cluster endpoint (hostname), port (default 5439), and database name. The AWS region is parsed from the endpoint automatically. You then choose either password authentication or IAM authentication. SSL mode defaults to require on every connection, with verify-ca and verify-full available.
How does KPI Tree connect to Redshift under the hood?
Redshift speaks the PostgreSQL wire protocol, so KPI Tree connects through the ADBC PostgreSQL driver and fetches results in Apache Arrow. There is no proprietary driver to install on your side. Queries are read-only SELECTs, and the connection pool is sized to Redshift's default WLM concurrency of five so scheduled syncs do not crowd out your analysts.
How does password authentication work?
The setup wizard creates a dedicated Redshift user, default username KPITREE, and auto-generates a 25-character password. Credentials are stored encrypted and the connection uses SSL mode require. You can customise the username and password if you prefer, and the grants are SELECT-only on the schemas you choose.
How does IAM authentication work?
KPI Tree calls the AWS get_cluster_credentials API to obtain temporary database credentials that are valid for one hour, so no long-lived database password is stored. This path is built for provisioned clusters. You can authenticate with an IAM role ARN, let it be auto-detected, or provide an AWS access key ID and secret access key directly.
Does KPI Tree work with Redshift Serverless?
The IAM temporary-credential flow uses the provisioned-cluster get_cluster_credentials API. To connect a Redshift Serverless workgroup, use password authentication with a database user over your Serverless endpoint on port 5439. The PostgreSQL wire protocol and Arrow transfer are identical, so metrics and off-warehouse analytics behave the same way.
How does KPI Tree affect my Redshift costs?
KPI Tree runs one scheduled query per metric regardless of how many users are active, and every downstream calculation runs off-warehouse in its own engine. Because interactive filtering, comparison, and drill-down never hit the cluster, you do not need to turn on Concurrency Scaling or resize the cluster to serve more viewers, and your WLM queues stay free for the analysts who need them.
What permissions does KPI Tree need?
A read-only user with SELECT access on the schemas that contain your metric data, and nothing else. The setup wizard generates the exact SQL to create the user and apply the grants, so the connection can read the tables your metrics need and can never write to the cluster.
Does KPI Tree work with dbt on Redshift?
Yes, through a separate dbt connection rather than the Redshift connector itself. Redshift is not a semantic-layer source, so if your dbt models materialise into Redshift you connect dbt Cloud or dbt Core as its own source and KPI Tree reads every metric definition, dimension, time grain, and aggregation type from there. See the dedicated dbt Cloud and dbt Core integration pages for the setup detail.
How is KPI Tree different from a BI tool or a semantic layer on Redshift?
A BI tool shows the number and a semantic layer defines how it is calculated. Both stop there. KPI Tree reads whatever you already have, raw SQL or a governed dbt layer, and adds the four things neither holds: statistically significant driver relationships with confidence levels, RACI ownership per metric, alerts routed to the accountable owner across Slack and email, and verification of whether the action moved the metric. The question shifts from what happened to what to do about it and whether it worked.
Does KPI Tree copy data out of Redshift?
KPI Tree queries your cluster on a schedule and processes aggregated daily results in its own engine. Raw row-level data is not persisted outside your environment. All Redshift security controls, including IAM policies, SSL requirements, and schema-level grants, remain fully enforced on every query.
Related guides. Frameworks and metrics in depth.

How to build a metric tree
A step-by-step metric tree and KPI tree template from North Star to daily levers
Metric decomposition
Break any business metric into the components that drive it
Semantic layer vs business context layer
A semantic layer settles what a metric is. It cannot settle how metrics drive each other, who owns them, or what happens when one moves.
Your Redshift data is ready. Make sure your team acts on it.
Connect Redshift to KPI Tree in under an hour. KPI Tree builds the accountability layer above your cluster that turns warehouse data into owned, routed, and verified action across every team, without adding a single interactive query to your bill.










