


 PostgreSQL Integration
Start where your data already lives. No warehouse required.
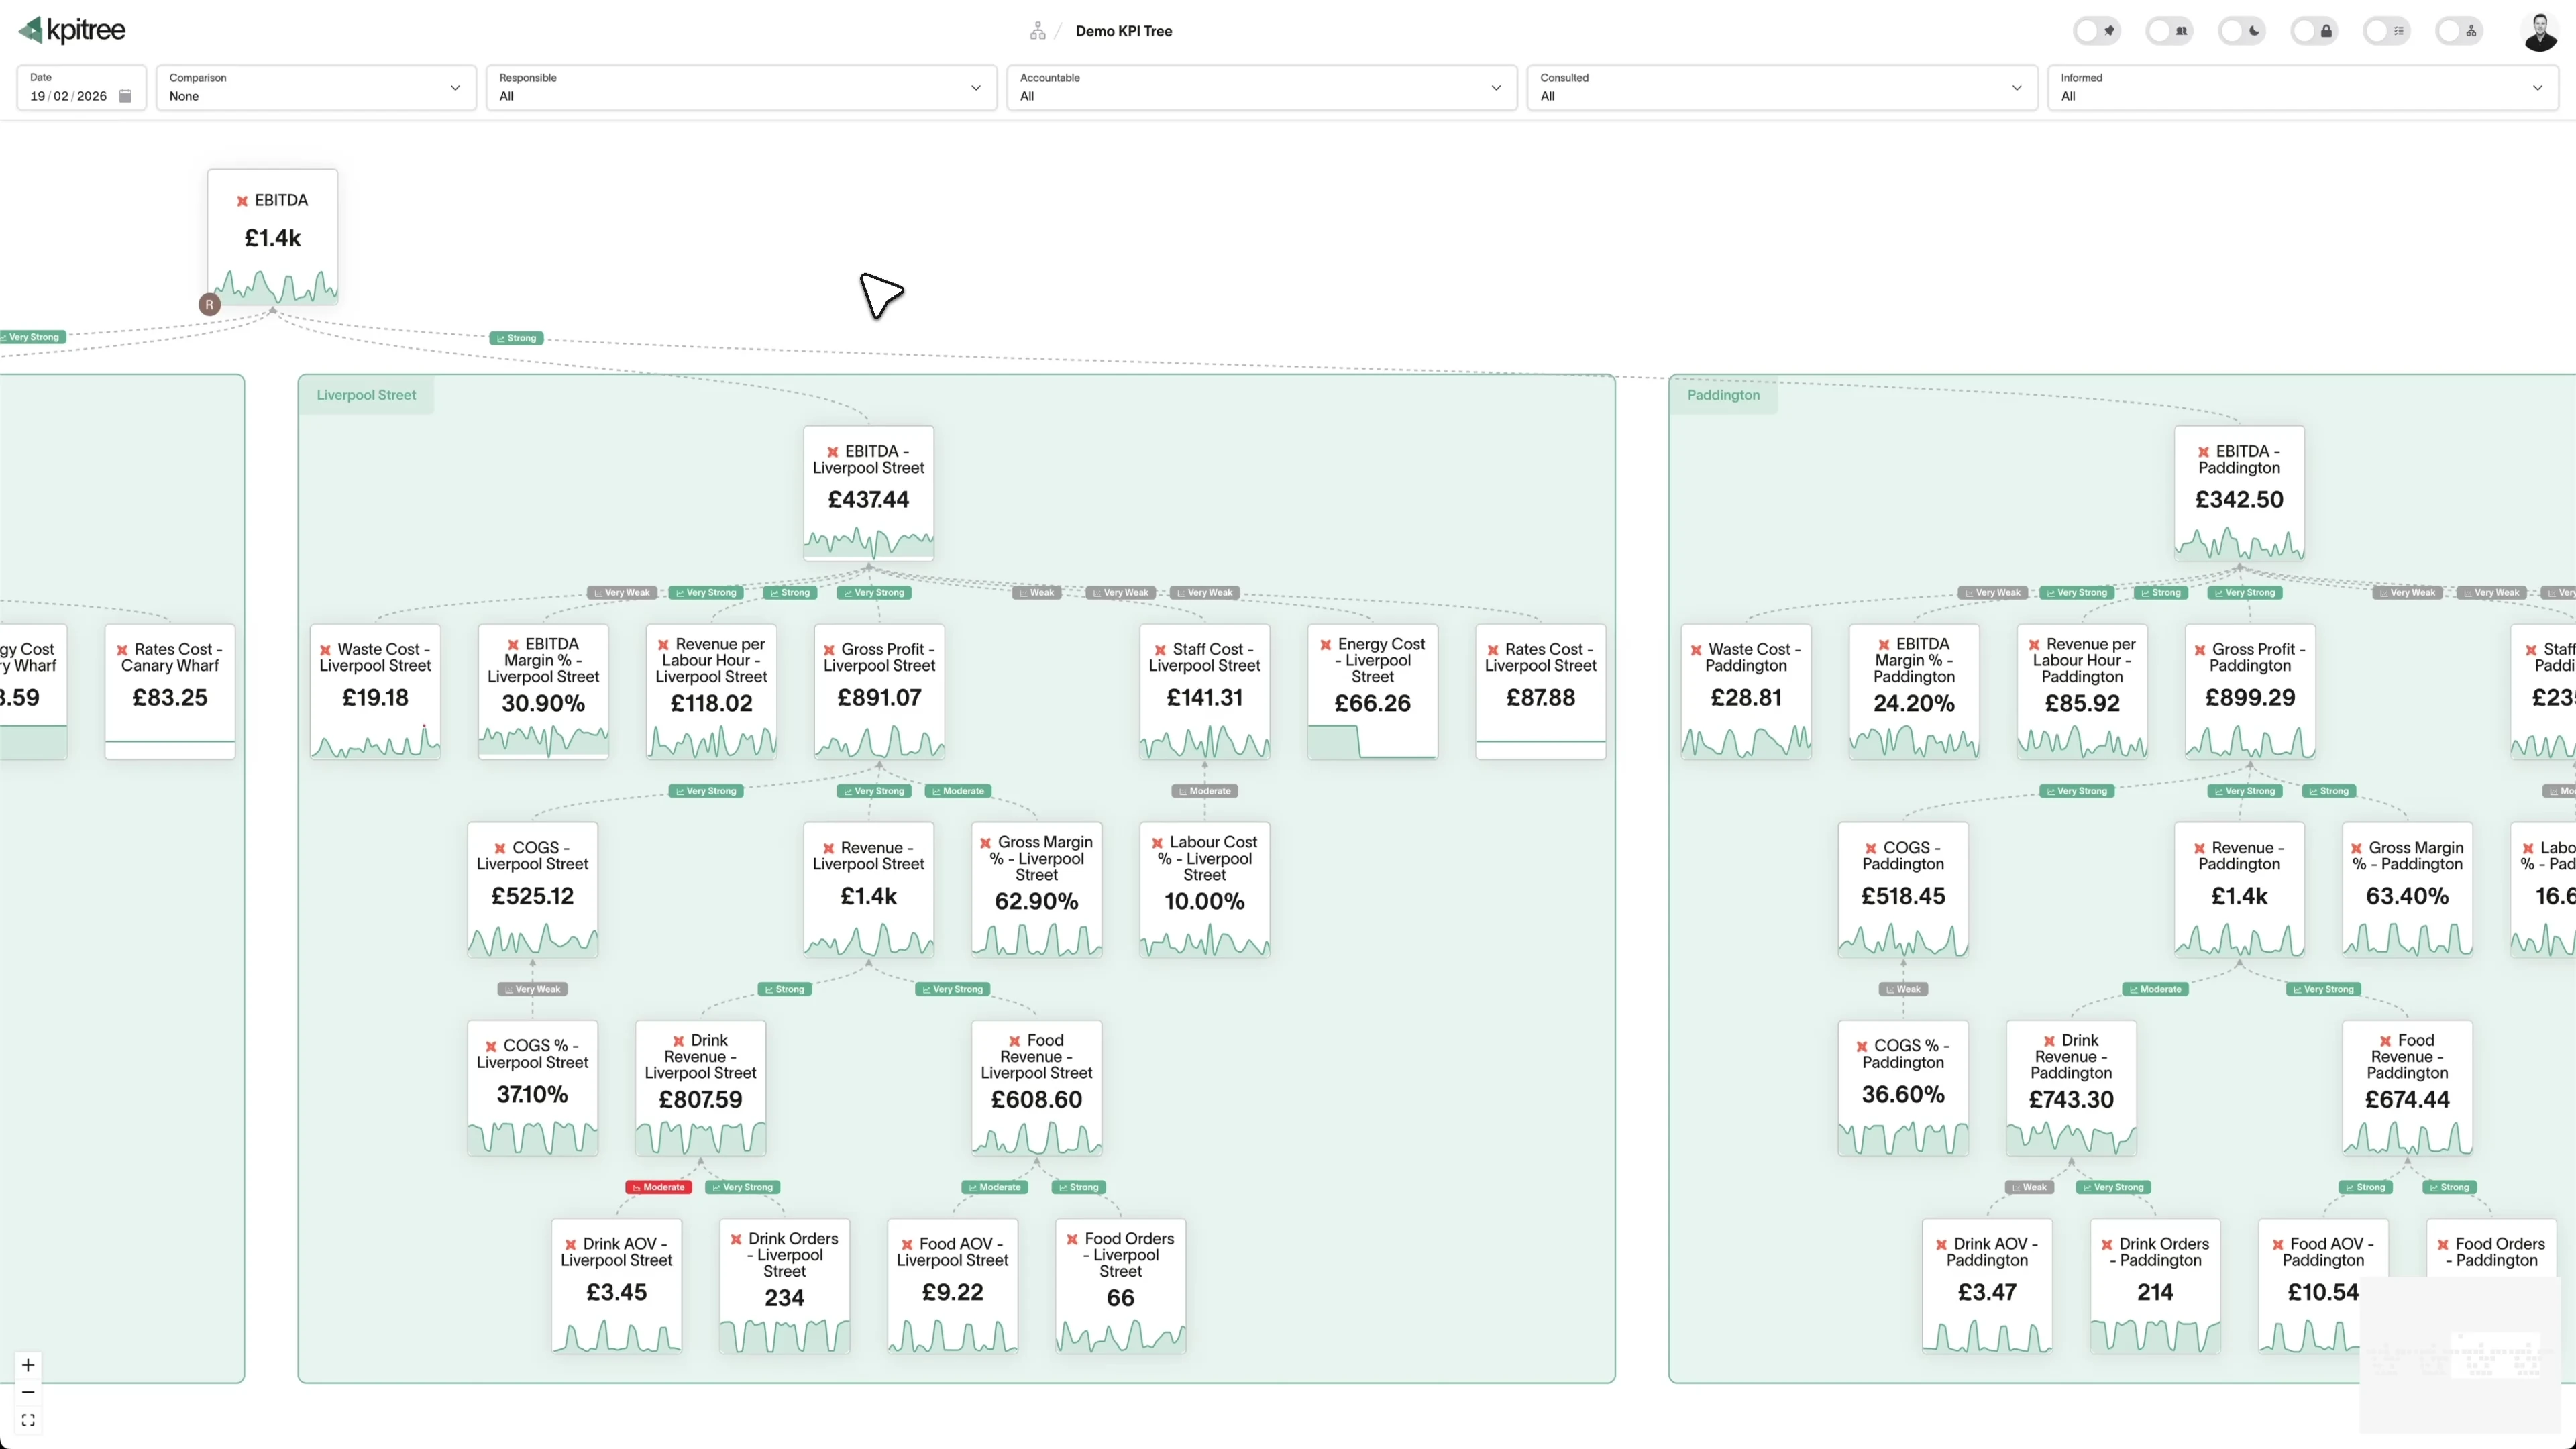
The metrics that matter most are already in your PostgreSQL database: signups, orders, activation rates, churn, feature adoption.The metrics that matter most are already in your PostgreSQL database: signups, orders, activation rates, churn, feature adoption. KPI Tree connects directly with a read-only user and adds the layer your application dashboards were never built to provide: causal metric trees that map how every metric drives the ones above it, an accountable owner at every level, statistical monitoring that catches shifts before they become problems, and personalised action plans that reach the people who can act. Each metric is fed by a single scheduled query that returns a daily series, and every comparison, correlation, and rollup runs off-database in KPI Tree's own engine, so your production instance never takes on analytical load. It works with any managed or self-hosted database that speaks the PostgreSQL wire protocol.
Connected in under an hour
Create a read-only PostgreSQL user
The setup wizard generates copy-paste SQL that creates a dedicated user with SELECT privileges on your target schemas. No write access, no DDL, no superuser grants. Paste it into psql or your admin console and run it. The same SQL works on any PostgreSQL-compatible database, whether managed or self-hosted.
Authenticate and connect
Provide your host, port (default 5432), database name, username, and password. For environments that require certificate authentication, supply the full SSL parameter set (sslmode, sslcert, sslkey, sslrootcert) for mutual TLS. KPI Tree validates the connection live with a lightweight test query before it saves anything, and your credentials are encrypted at rest. IP allow-listing is available so your database firewall only accepts connections from KPI Tree's static IP.
Define metrics and start acting on them
Write a SQL query against your application tables for each metric. KPI Tree reads the aggregation type straight out of your SQL, so a running count sums across days while a point-in-time snapshot takes the period-end value with no extra configuration. Each query runs on a schedule you set. From there, map how metrics drive each other, assign an accountable owner at every level, and let the statistical engine surface what moved and why.
Map, measure, prove, and act on the data you already have
One query per metric, all analytics off-database
Causal driver signals with confidence, not just charts
Works with every PostgreSQL-compatible database
Your team does not need a warehouse to take metrics seriously.
- Connect with host, port, database, username, and password
- Aggregation type read directly from your SQL, no manual configuration
- Each metric gets an owner, trend analysis, and statistical alerts
- No warehouse or ETL pipeline required to get started
Your production database stays protected. Full stop.
- Scheduled queries only, never triggered by page loads, filters, or drill-downs
- Read-only user with SELECT grants on chosen schemas only
- SSL with optional client certificate authentication (sslmode, sslcert, sslkey, sslrootcert)
- All downstream computation runs off-database in KPI Tree's engine
Built for teams whose metrics live in the app database.
- Signups, orders, activation rates, churn, and revenue are already in your tables
- RACI ownership at every level, tied to team, department, and manager
- Anomalies routed to the accountable owner across Slack and email
- Every action checked against whether the metric it targeted actually moved
Combine PostgreSQL data with every other source your business uses.
- PostgreSQL metrics in the same tree as warehouse, SaaS, and advertising metrics
- Correlation analysis across sources surfaces cross-functional relationships
- End-to-end accountability from acquisition through to retention
- Each metric node carries its owner regardless of which source it came from





How KPI Tree uses PostgreSQL differently
Most tools either require a warehouse first or treat the application database as a live query engine, hammering production every time a dashboard loads. KPI Tree treats PostgreSQL as a source, queries it lightly on a fixed schedule, and sits on top of it solving the problem dashboards never do: getting the right person to act, and proving it worked.
Data warehouses
The numbers






Semantic layers
The definitions



Business apps
Launches, decisions, blockers




Org structure
Directory-synced




For humans
Answers, briefings and pushes
 @
@Read and write over MCP
Anthropic: 21% → ~95% with curated context



Canopy Agentic Workflows the metrics start them, humans gate them
Canopy Agents four out of the box, any model, your keys
Canopy
The business context layer
Structural context The causal tree, the org chart
Temporal context What was true when, plan against actual
Behavioural context What people did, what worked
Operational context RACI, workflows, approvals
Strategic context Objectives, key results, initiatives
Map & Measure
Metric Trees
Business Models
Prove & Act
Root Cause
Ownership
Verified Impact
Strategy
Grounded in proven causality
Verified proof
Meta spend → Revenue, +£32k vs forecast, q < 0.01
Personalised Action Plans 31 experiments running
hypothesis → a real person’s plan → measure the change
Causation the test cascade
ADF p 0.02 → Granger p 0.003 → q < 0.05, 87 of 1,204 survive
Correlation
22,791 pairs tested nightly, NPS – Churn r 0.71
Data warehouses
The numbers
Semantic layers
The definitions
Business apps
Launches, decisions, blockers
Org structure
Directory-synced
Statistical drivers, not two charts side by side
Ownership, routed action, and verified impact
Production-safe by design
Related integrations. More sources that work with KPI Tree.
Common questions
What connection details does KPI Tree need?
Host, port (defaults to 5432), database name, username, and password. For environments that require client certificate authentication, you can also provide sslmode, sslcert, sslkey, and sslrootcert for mutual TLS. The setup wizard validates the connection live with a lightweight test query before it saves anything.
Do I need a data warehouse to use KPI Tree?
No. KPI Tree connects directly to PostgreSQL as a database source. You can build causal metric trees, assign RACI ownership, run statistical monitoring, and deliver routed action plans with no warehouse at all. If you later connect a warehouse like Snowflake or BigQuery, its metrics sit in the same trees alongside your PostgreSQL metrics, so you are never migrating, only adding a source.
Does this work with managed PostgreSQL services?
Yes. KPI Tree works with any database that speaks the PostgreSQL wire protocol: Google Cloud SQL, Amazon RDS, Amazon Aurora, Supabase, Neon, Crunchy Bridge, Aiven, DigitalOcean Managed Databases, Azure Database for PostgreSQL, and self-hosted instances. There are no vendor-specific extensions or custom drivers to install.
Will KPI Tree slow down my production database?
No. KPI Tree runs one read-only query per metric on a configurable schedule. Everything downstream, including comparison periods, correlations, outlier detection, and root-cause analysis, runs off-database in KPI Tree's own engine over cached results. There are no per-user queries, no real-time streaming, and no write operations, so the load on your database stays predictable regardless of how many people are using KPI Tree.
What permissions does KPI Tree need?
A dedicated PostgreSQL user with SELECT privileges on the schemas containing the tables you want to query. No write access, no DDL, no superuser. The setup wizard generates the exact CREATE USER and GRANT statements you need.
How does KPI Tree work out what is driving a metric?
It runs our own proprietary ML models and an array of statistical tests over your metric histories, correcting for false positives across many candidate relationships. Each driver relationship in the tree carries a confidence level, so a data or engineering team can see which links are statistically supported rather than assumed.
How does KPI Tree decide how a metric rolls up across days?
It reads the aggregation directly from your SQL. A query that counts or sums events rolls up by summing across the period, while a point-in-time snapshot such as active subscriptions takes the period-end value. Sum, count, distinct count, average, min, max, first value, and last value are all supported, and business-model values such as budgets and forecasts flow through exactly the same pipeline as your actuals.
Is the connection secure?
Yes. KPI Tree supports SSL on every PostgreSQL connection, with optional client certificate authentication for mutual TLS (sslcert, sslkey, sslrootcert). IP allow-listing is available so your database firewall only accepts connections from KPI Tree's static IP, and all credentials are encrypted at rest with HSM-backed KMS.
Can I use KPI Tree with dbt?
Yes. If your dbt project materialises models into PostgreSQL, you can point KPI Tree at the same database and query those models directly. If you want to consume metric definitions from a semantic layer instead, KPI Tree has dedicated dbt Cloud and dbt Core integrations that import the definitions and let the semantic layer do the calculation.
Related guides. Frameworks and metrics in depth.
Your application database already holds the metrics that matter.
Connect PostgreSQL to KPI Tree in under an hour, with no warehouse needed. Your production database takes on no analytical load, and the accountability layer turns operational data into owned, routed, and verified action across your organisation.










